New And Existing Home Sales: Fact vs Spin


Existing home sales, reported last Thursday, were down 3.7% from February (down 6.3% in February). Wall St was thinking they would rise 0.8%. The seasonally adjusted annualized sales rate dropped to 7-month lows. The reason for struggling existing home sales is three-fold. First and most obvious is rising mortgage rates. If the Fed had not been throwing at least $80 billion per month at the mortgage market, mortgage rates would have been rising since last April and would be much higher than current mortgage rates. This would have prevented the double digit housing price inflation of the last 12 months, which to a large degree is starting to “freeze” housing market activity.
The other two reasons are creations of the Fed and the Government. Existing home inventory fell to 900k homes, down more than 28% from a year ago. I saw a statistic a couple weeks ago that said there’s now more realtors than homes on the market. The primary culprit for the low inventory is affordability – both price and monthly expense. Most households that might otherwise look to buy a move-up home can no longer afford to do so. So there’s no reason for them to sell their house until it becomes unaffordable to maintain. This may be moot anyway because many potential first-time buyers can no longer afford to buy a home period.
Existing home prices were up 18.4% from last March, though down 4.3% from February (nationally, I know some areas are still seeing crazy price increases). While supply and demand are one of the drivers of price, the north of $1 trillion the Fed has thrown at the housing market since last March is the main driver of price.
That, and the fact that the Government has removed debt-to-income and down payment restrictions for conforming Fannie/Freddie mortgages. In addition, the loan limit was raised again this year, which enables homebuyers to take out an even bigger mortgage than last year if they can qualify for a conforming mortgage. Private-label mortgages are more expensive but they’re even more liberal with loan-to-value restrictions. The latter dynamic is a direct creature of the Fed.

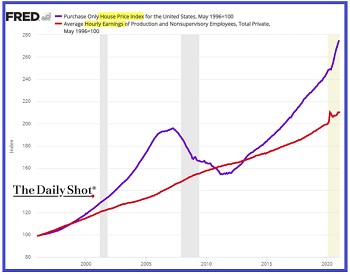
The chart shows the spread between the Fed’s purchase-only house price index (blue line) and the average hourly earnings of production and non supervisory employees (red line). The differential is even bigger now than it was at the peak of the 2003-2008 housing bubble. This trend is not sustainable. One catalyst that might cause home prices to tank is if the Government removes the mortgage payment deferment program, which encompasses around 7 million households. Additionally, many of the urban homes that have been left vacant, by those owners who can afford to buy a suburban/resort home and maintain the urban dwelling, eventually will come on the market.
Since the 2nd quarter of 2020, the share of second home and investor mortgage applications has surged from 7% to 14% of all purchase mortgage application. To my knowledge it has never been higher. This dynamic both removes inventory from the market and drives prices higher.
The bottom line is that the housing market is quickly becoming dysfunctional from the enormous amount of Fed and Government intervention in the housing and mortgage markets.
New homes sales were reported on Friday with a headline number that purports the seasonally adjusted annualized rate of home sales jumped 20.7% from February. To be sure, with February’s SAAR number down 16.2% from January, partly attributable to weather-related issues, it makes some sense that new home contract signings (new homes are based on contracts signed) were pushed into March from February. But March contract signings on a SAAR basis were up just 1% from January. Thus, on the assumption that indeed some Feb contracts were pushed into March, it’s quite likely that February and March were both lower than January.
The table above is excerpted from the Census Bureau’s March new home sales report. I’ve highlighted the Jan, Feb, Mar SAAR sequence for the entire country. Keep in mind this is the SAAR data, which includes “seasonal adjustments” plus it annualizes the monthly number. This leaves plenty of room for statistical errors, notwithstanding the usual statistical games played by the statisticians. Also highlighted in yellow is the 90% confidence interval, which means that the actual number falls within a range from -3.7% to +44.4% with 90% confidence. This statistical volatility embedded in the new home sales report is absurd, which is why John Williams refers to the new home sales data series as “nonsensical” and “unreliable.”
Finally, while mortgage purchase applications rose each week during March on average 1-2% per week, the number does not remotely correlate with the alleged 20.7% SAAR increase in contracts signed (“new home sales”). My best guess is that, to the extent that contract signings might have been pushed in to March from February, the Census Bureau’s “adjustment” model overestimated the number of contracts signed in March vs February, given what was likely an higher number of contracts signed in March vs February compared to historical data.
I therefore expect a big downward revision to the March number in April. Also, I’ll note that purchase applications are a decent statistical proxy for sales because 90% of new homes are purchased using a mortgage. That said, the downward revision never captures canceled contracts – which typically run about 10% per quarter right now – because the Census Bureau does not track cancellations and does not revise its estimates based on actual canceled contracts.
One last interesting note on new homes sales. The median price was down 4.4% from February and 10% from the high in December. If the market were as hot as the media makes it out to be, homebuilders would not have had to take a hatchet to sale prices. While lumber inflation won’t be disastrous for homebuilder Q1 numbers, falling prices and rising cost inputs will have a highly negative affect on homebuilder earnings in Q2. In all of the housing market analysis I’ve seen lately, this factor has not been mentioned with regard to homebuilder earnings.
The housing sector is as tough as any to short right now, but that may be changing. It takes 6-7 months to build a new construction home. Maybe a little quicker for the crappy Beazer and KB Home homes. The price of lumber has gone from $260 to $1370 (110,000 board feet contract). But it’s not just lumber. Price inflation has affected the cost of pretty much all of the materials used to build a home including labor. And selling prices appear to be falling. With these headwinds I have to believe homebuilder numbers will suffer starting in Q2. At some point the stock market will start to anticipate this.
*********


