NYSE Margin Debt At An All-Time Record High Heralds An Impending Stocks Crash


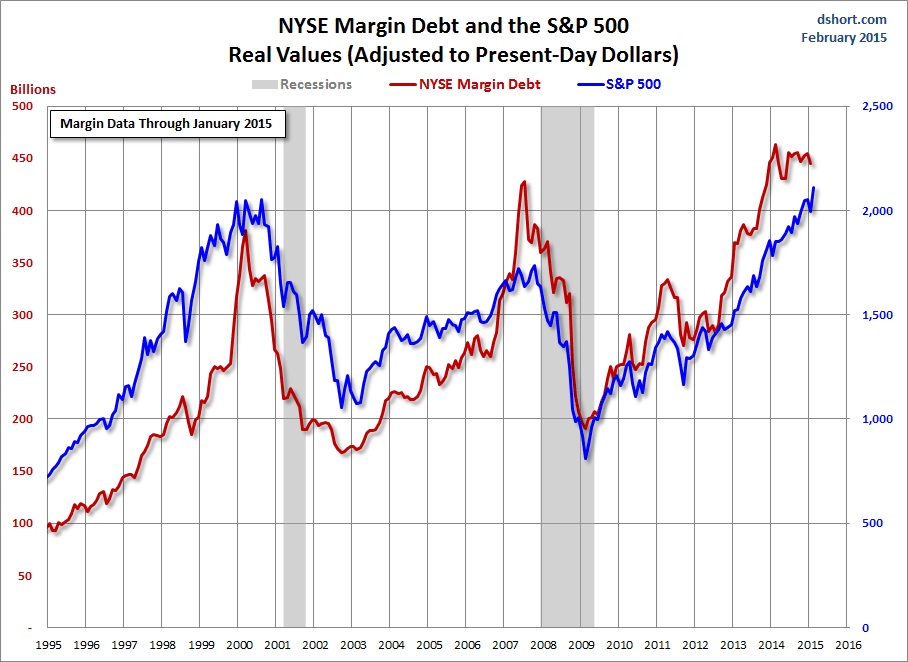
The astonishing surge in leverage (i.e. NYSE Margin Debt) in late 1999 peaked in March 2000, the same month that the S&P500 hit its all-time daily high, although the highest monthly close for that year was five months later in August. A similar surge NYSE Margin Debt began in 2006, peaking in July 2007, three months before the market peak…and subsequent crash.
Debt hit a trough in February 2009, a month before the March market bottom. It then began another major cycle of increase. It is imperative to note NYSE Margin Debt hit an all-time high in February of this year.
The latest Margin Data
Unfortunately, the NYSE margin debt data is a month old when it is published. Real (inflation-adjusted) debt hit its all-time high in February 2014, after which it margin declined sharply for two months, but by June it had risen to a level about two percent below its high and then oscillated in a relatively narrow range. The latest data point for January is four percent off its real high eleven month ago.
The next chart shows the percentage growth of the two data series from the same 1995 starting date, again based on real (inflation-adjusted) data. I've added markers to show the precise monthly values and added callouts to show the month. Margin debt grew at a rate comparable to the market from 1995 to late summer of 2000 before soaring into the stratosphere. The two synchronized in their rate of contraction in early 2001. But with recovery after the Tech Crash, margin debt gradually returned to a growth rate closer to its former self in the second half of the 1990s rather than the more restrained real growth of the S&P500. But by September of 2006, margin again went ballistic. It finally peaked in the summer of 2007, about three months before the market began to crash.
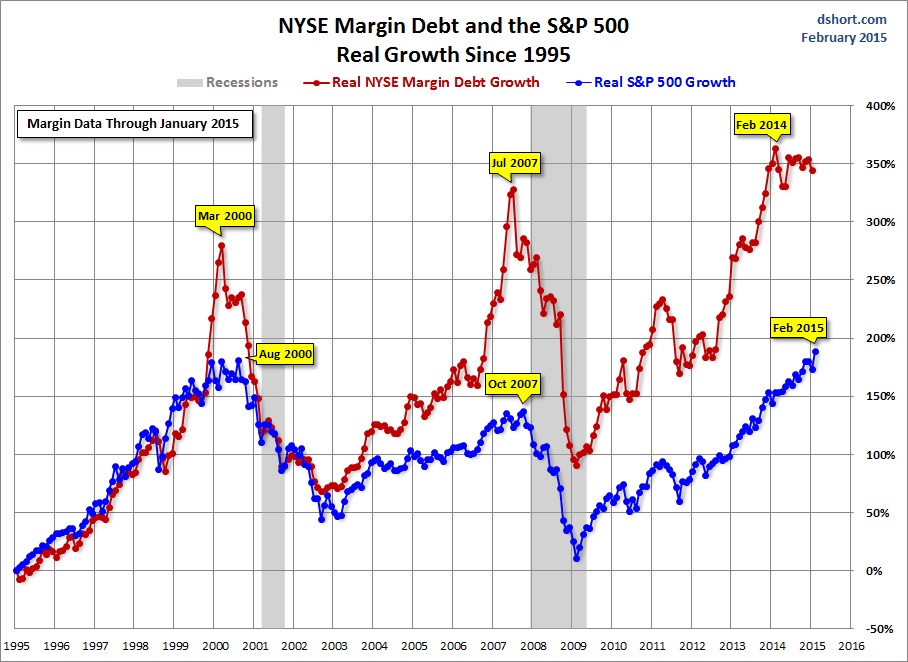
After the market low of 2009, margin debt again went on a tear until the contraction in late spring of 2010. The summer doldrums promptly ended when Chairman Bernanke hinted of more quantitative easing in his August, 2010 Jackson Hole speech. The appetite for margin instantly returned, and the Fed periodically increased the easing. Now that QE over, it will be particularly interesting to watch debt levels in the months ahead.
Gold-Eagle Editor’s Observations:
Doug Short’s brilliant charts demonstrate the uncanny accuracy of the NYSE Margin Debt as a metric in calling market peaks in US stocks. Consider: The NYSE Margin Debt peaked in March 2000, which heralded a 50% decline in the S&P500 Index during the next 29 months. And again in July 2007, the NYSE Margin Debt peaked which paved the way for the S&P500 to plummet 55% during the next 18 months. And recently in February 2014 the NYSE Margin Debt peaked…but remained to this day at near all-time record levels. However, the S&P500 Index still dangerously flirts with all-time record highs. Indubitably, stocks will soon lose their upward momentum as unbridled greed and irrational exuberance wane, and consequently roll-over into a bear market mode.
Therefore if history is testament, investors should anticipate a horiffic bear market to commence in 2015 and last well into next year.
Courtesy of http://www.advisorperspectives.com/
********
Related Articles
Billionaire Buffett May Repeat His Bear Market Fiascos Of 1998-2000 And 2007-2009
Regression to Trend: A Perspective on Long-Term Market Performance
NYSE Margin Debt Drifts Higher In November
Warren Buffett Predicting Upcoming Stock Market Crash
Stock Bears Are Preparing To Run Amok…Worldwide
 My original dshort.com website was launched in February 2005 using a domain name based on my real name, Doug Short. I'm a formerly retired first wave boomer with a Ph.D. in English from Duke and a lifelong interest in economics and finance. In 2011 my website was acquired byAdvisor Perspectives, where I serve as the Vice President of Research.
My first career was a faculty position at North Carolina State University, where I achieved the rank of Full Professor in 1983. During the early '80s I got hooked on academic uses of microcomputers for research and instruction. In 1983, I co-directed the Sixth International Conference on Computers and the Humanities. An IBM executive who attended the conference made me a job offer I couldn't refuse.
Thus began my new career as a Higher Education Consultant for IBM — an ambassador for Information Technology to major universities around the country. After 12 years with Big Blue, I grew tired of the constant travel and left for a series of IT management positions in the Research Triangle area of North Carolina. I concluded my IT career managing the group responsible for email and research databases at GlaxoSmithKline until my retirement in 2006.
More from Silver Phoenix 500


