Oil Bulls, Are You Serious About Arresting The Slide?


We have said the bulls had a bad day on Wednesday. How would you rate their yesterday’s performance? Heck, they are not having a good day today either. Black gold is heading for the biggest weekly loss in 2019. Has the support fallen out from below? Where can we expect the decline to stop?
Let’s take a closer look at the chart below (charts courtesy of http://stockcharts.com).
We presciently wrote these words on Wednesday:
(…) As we have pointed to in our yesterday Alert's title ("The Shifting Sands in the Oil Arena"), this suggests a bearish reversal of fortunes ahead. (…) Such a move lower is supported by the unconvincingly low volume of the preceding upswing days.
Yesterday, we have added:
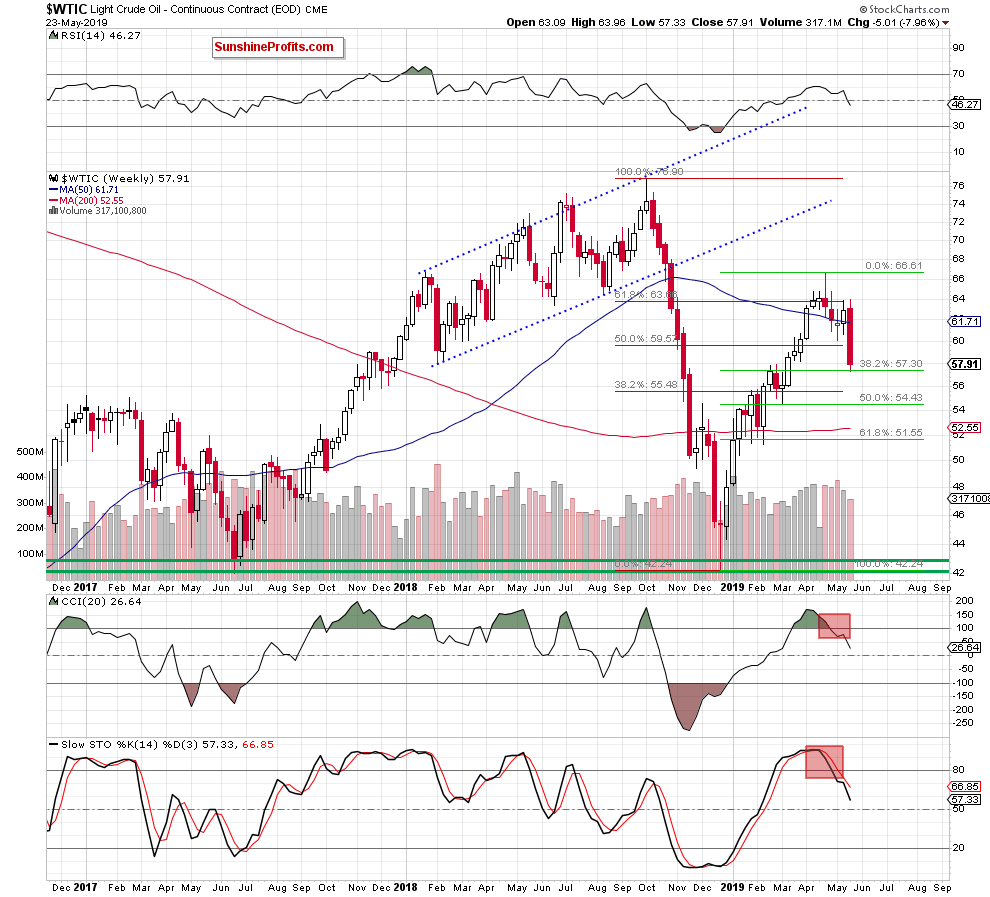
(…) the previously-broken 61.8% Fibonacci retracement stopped the buyers. Just like it had stopped them last week too.
Black gold has pulled back and slipped below the 50-week moving average. This could trigger further deterioration in the following days or even weeks. It's especially so when we factor in the sell signals of the weekly indicators.
Last two days, black gold plunged like there’s no tomorrow. The large red candle has made our short positions even more profitable.
Let’s see the reflection on the daily chart.
Before answering this question, let’s recall our yesterday’s Alert again:
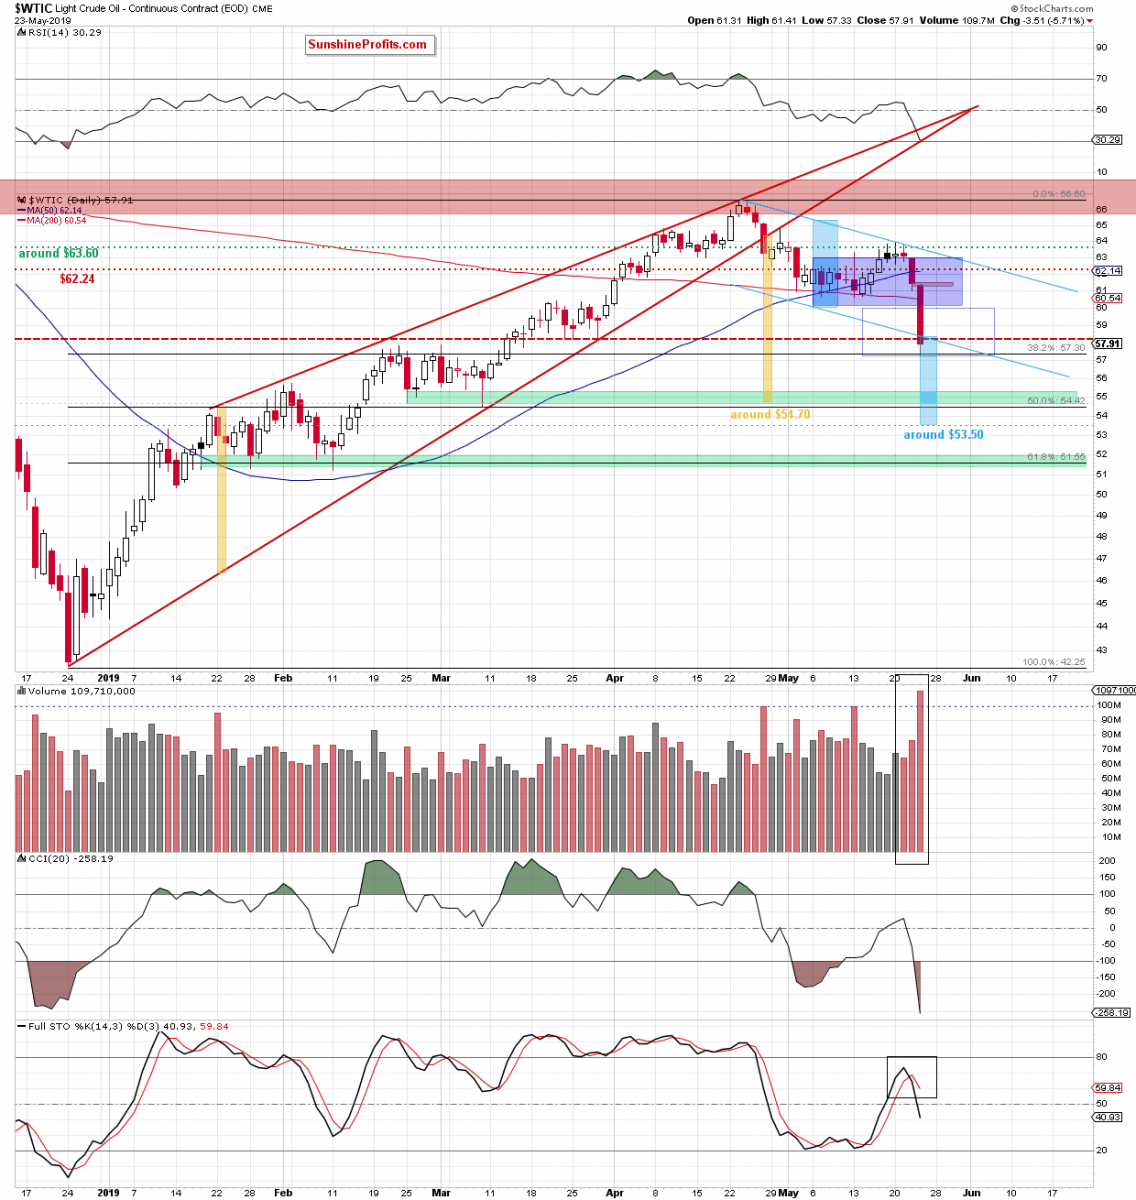
(…) Light crude not only declined below the previously-broken upper border of the blue consolidation, but also closed the day below the 50-day moving average. This doesn't bode well for higher prices ahead.
(…) Wednesday's downswing materialized on visibly higher volume than all the preceding upswing days. This points to increasing participation of the sellers and their willingness to push prices even lower. Additionally, the Stochastic Oscillator's previous buy signal just turned into a sell signal.
These are negative developments for the bulls. They hint at further deterioration in the coming days. How low could crude oil go?
The first downside target for the sellers will be the lower border of the blue consolidation (at around $60). (…) Should the bears succeed in getting a daily close below the blue consolidation in the coming days, the probability of testing the late-March lows will increase significantly.
Oil bears not only took the commodity below the lower border of the blue consolidation but also managed to reach two important areas. First, it’s the 38.2% Fibonacci retracement and then, the area where the size of the downward move corresponds to the height of the blue consolidation.
Some bears took profits off the table yesterday, and black gold slightly rebounded. Crude oil however still finished the day below the late-March lows (the dashed red horizontal line is based on them and serves as a resistance). Coupled with the weekly picture, the position of the daily Stochastic Oscillator and the significant volume of yesterday’s sharp decline, further deterioration may be just around the corner.
Indeed, today’s recovery attempt has fizzled out and at the moment of writing these words, oil trades at around $57.70. The bearish onslaught continues.
This scenario is also reinforced by the fact that yesterday’s drop took light crude below the lower border of the declining blue trend channel. If the commodity extends losses from here, we could see a drop even to around $53.50, where the size of the decline corresponds to the height of the channel.
But the first target for the sellers will be a bit higher – at around $54.70, where the size of the downward move equals the height of the rising red wedge (as marked with yellow rectangles).
This is the area marked by the 50% Fibonacci retracement, the late-February and early-March lows. They together create the green zone serving as the next important support for the bulls.
As if the picture wasn’t bearish enough already, let’s mention one more thing. It’s the gap between Wednesday’s close and Thursday’s open. It serves as an important resistance now. Let’s have a look where saw a similar price action in the past already.
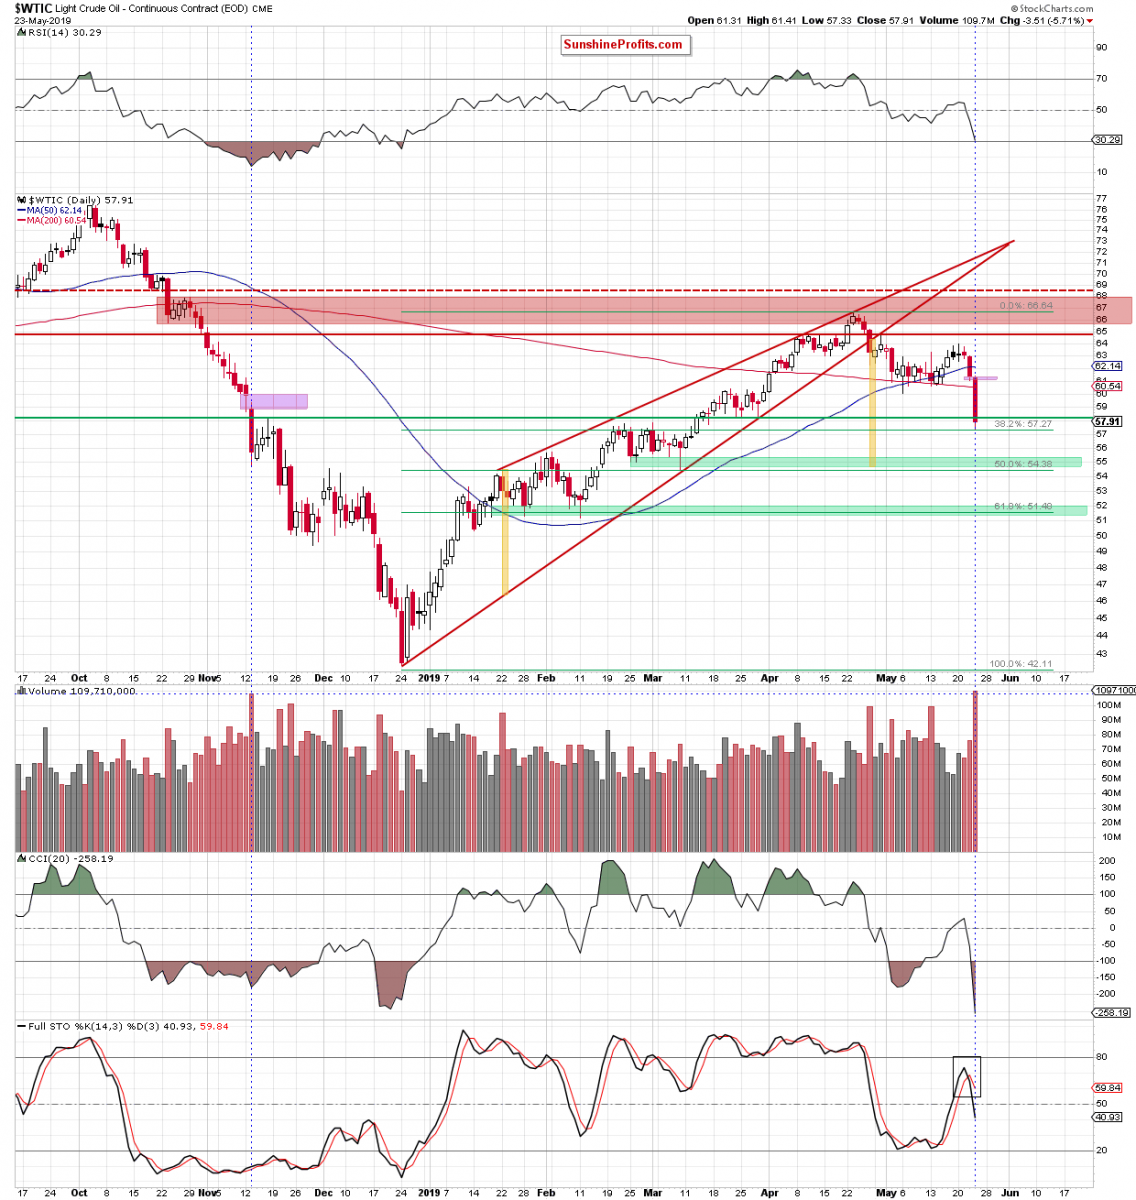
Crude oil has created a similar gap in November 2018 – that’s not too far from yesterday’s gap. Back then, oil bears also created a long red candlestick on very high volume (it’s marked with a blue vertical line). There was an attempt to repair the damage in the following days but the bulls’ efforts failed after a few days, and light crude declined again.
Summing up, the outlook for oil is bearish. As the bulls have been unable to overcome the previously-broken red horizontal line and the 50% Fibonacci retracement several days in a row, last two days revealed their weakness in full. Oil truly plunged and marches lower also today. Both the weekly and daily indicators continue to support lower prices. The daily volume examination concurs and the short position continues to be justified.
*********
Today's article is a small sample of what our subscribers (and sometimes members of our free mailing list) enjoy regularly. The full version of today’s analysis digging even deeper into the downside targets question can be accessed on our website in the free articles section. There’re also other recent free articles. You are welcome to drop by anytime and have a look.
Nadia Simmons
Forex & Oil Trading Strategist
Sunshine Profits - Tools for Effective Gold & Silver Investments
* * * * *
All essays, research and information found above represent analyses and opinions of Przemyslaw Radomski, CFA and Sunshine Profits' associates only. As such, it may prove wrong and be a subject to change without notice. Opinions and analyses were based on data available to authors of respective essays at the time of writing. Although the information provided above is based on careful research and sources that are believed to be accurate, Przemyslaw Radomski, CFA and his associates do not guarantee the accuracy or thoroughness of the data or information reported. The opinions published above are neither an offer nor a recommendation to purchase or sell any securities. Mr. Radomski is not a Registered Securities Advisor. By reading Przemyslaw Radomski's, CFA reports you fully agree that he will not be held responsible or liable for any decisions you make regarding any information provided in these reports. Investing, trading and speculation in any financial markets may involve high risk of loss. Przemyslaw Radomski, CFA, Sunshine Profits' employees and affiliates as well as members of their families may have a short or long position in any securities, including those mentioned in any of the reports or essays, and may make additional purchases and/or sales of those securities without notice.


