Oil Takes Center Stage: Commodities Halftime Report 2018


Near the beginning of the year, Goldman Sachs analyst Jeffrey Currie made the case that the macro backdrop right now favored commodities in 2018. With inflation pushing prices up and world economies borrowing record amounts of capital, it was the best time “in decades,” he said, for investors to have exposure to base metals, energy and other materials.
“Commodities had a miserable year” in 2017, Currie told CNBC. “History says commodities will outperform equities this year.”
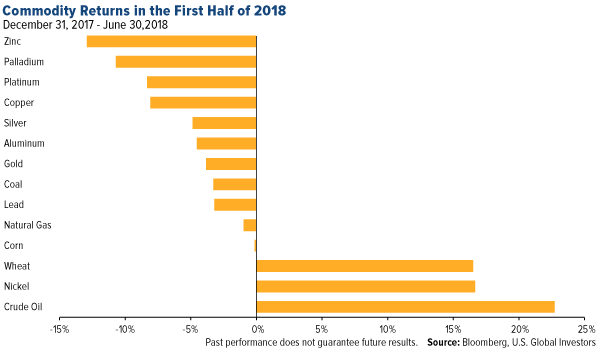
Currie’s forecast has been mostly accurate so far. Except for a rocky June, commodities have been one of the best performing asset classes in the first half of the year. From January to the end of May, the group, as measured by the Bloomberg Commodities Index, rallied close to 3 percent—170 basis points ahead of the S&P 500 Index. Advances were largely driven by crude oil, which currently seeks to close above $80 a barrel for the first time since November 2014.
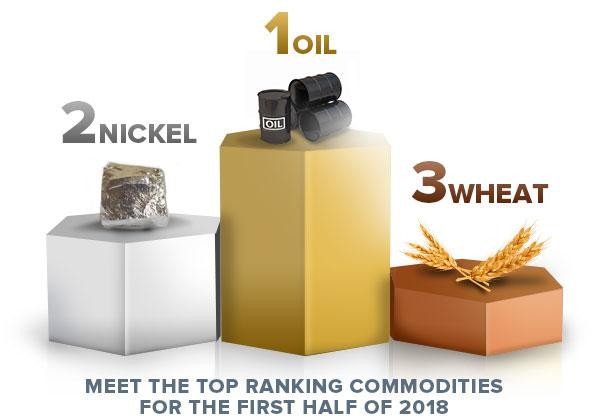
Of the 14 major commodities we track at U.S. Global Investors, oil was the standout performer, gaining roughly 23 percent, followed by nickel (up 16.76 percent) and wheat (16.51 percent). You can view our always-popular, interactive Periodic Table of Commodity Returns by clicking here.
There are a number of factors supporting oil right now, not least of which is President Donald Trump’s decision to withdraw the U.S. from the Iran nuclear deal. The move has the potential to significantly curb exports out of the Middle Eastern country, responsible for about 4 percent of the world’s supply. Markets were further disrupted two weeks ago when the U.S. government warned importers to stop buying Iranian oil or face sanctions.
In addition, supply is being squeezed by worsening economic conditions in Venezuela, which sits atop the world’s largest known oilfield, and conflict in Libya, home to Africa’s largest oil reserves. On Wednesday of last week, though, Libya indicated it would resume exports from its eastern ports, which sent Brent crude down more than 2 percent.
Global Oil Consumption Blasted to New Heights
Many investors might be inclined to believe the oil rally is over, but I think we could continue to see movement to the upside on further supply restrictions and rising demand. In its June Statistical Review of World Energy, British oil and gas giant BP reports that consumption grew for the eighth straight year in 2017, climbing to 98.2 million barrels per day (bpd) for the first time ever. We would need to see growth of only 2 percent by the end of this year for demand to reach and surpass 100 million bpd—a phenomenally large sum.
This could be achieved if Chinese demand growth remains as robust as it’s been for the past decade. Consumption stood at 12.8 million bpd in 2017, a new record for the country. This figure is up 64 percent from only 7.8 million bpd in 2007.
Although China is now the world’s number one auto market in terms of sheer size, vehicle and vehicle finance penetration are still relatively low compared to the U.S., Japan, Germany and other major economies. There were about 115 vehicles per 1,000 people in 2015, according to J.D. Power, compared to the U.S. with 800 vehicles per 1,000 people. That means there’s plenty of upside potential for energy as more Chinese households are able to afford automobiles.
Speaking of autos, the excitement over electric vehicles (EVs) is helping to drive up the cost of nickel, vital in the production of lithium-ion batteries. In the first six months of the year, the price of nickel rose close to 17 percent, to $14,823 per metric ton. As impressive as that is, it’s still three and a half times below its all-time high of $54,050, set in May 2007.
Commodities Now a Buy: Goldman Sachs
As I said earlier, commodities had a rough June, falling some 3.64 percent as trade tensions between the U.S. and China escalated. This was the group’s biggest monthly slump in nearly two years, led by copper and soybeans.
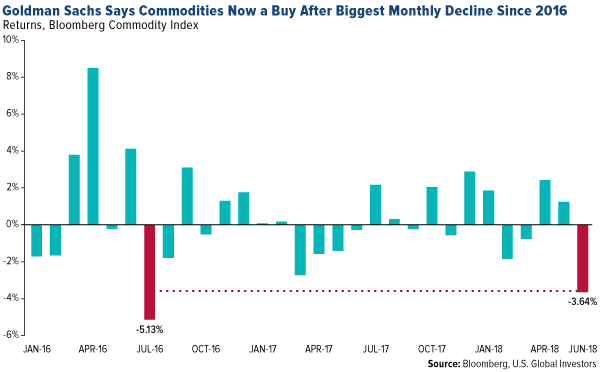
Goldman analysts say this has created a well-timed buying opportunity, as the selloff was overdone. According to the bank, the U.S.-China trade war impact on commodities “will be very small, with the exception of soybeans where complete rerouting of supplies is not possible.”
Goldman now forecasts a 10 percent return on commodities over the next 12 months as the U.S. dollar corrects and trade fears subside.
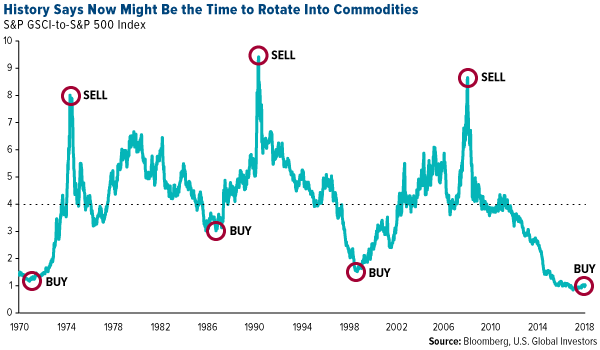
If you recall, I made a similar bullish call on commodities back in April after showing that, relative to equities, commodities are as cheap now as they’ve possibly ever been. They’re even cheaper than they were in 2000, before the start of the last commodities super cycle. Had you invested in a fund tracking a commodities index in 2000, you would have seen your money grow at a compound annual growth rate (CAGR) of around 10 percent for the next 10 years, according to Bloomberg data.
Copper Demand Should Accelerate With Electric Vehicle Sales
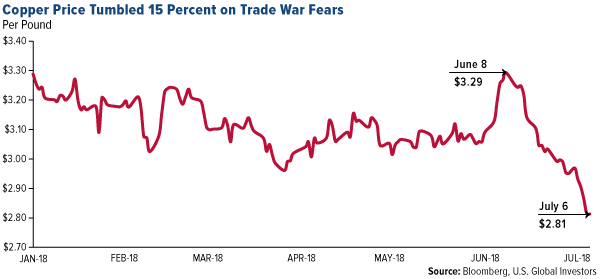
Among the most attractive opportunities I see is copper, which rose to an 11-month high of $3.29 per pound in early June before sinking 15 percent. Like nickel, copper has benefited from the forecast that EV adoption will accelerate. According to Bloomberg New Energy Finance, EV sales are expected to grow from a record 1.1 million units worldwide in 2017, to 11 million in 2025, then to 30 million in 2030.
This is good news for copper. As I’ve pointed out before, EVs require three to four times as much copper as traditional gas-powered vehicles.
“You’re going to need a telescope to see copper prices in 2021,” Robert Friedland, billionaire founder and executive chairman of Ivanhoe Mines, told us back in January when he visited our office.
Robert’s comment might be hyperbolic, but the thing to keep in mind is that demand for the red metal is about to turn red hot.
Explore investment opportunities in commodities here!
All opinions expressed and data provided are subject to change without notice. Some of these opinions may not be appropriate to every investor. By clicking the links above, you will be directed to third-party websites. U.S. Global Investors does not endorse all information supplied by these websites and is not responsible for their content.
Holdings may change daily. Holdings are reported as of the most recent quarter-end. The following securities mentioned in the article were held by one or more accounts managed by U.S. Global Investors as of 03/31/2018: BP, Ivanhoe Mines Ltd.
The Bloomberg Commodity Index is made up of 22 exchange-traded futures on physical commodities. The index represents 20 commodities, which are weighted to account for economic significance and market liquidity.
The S&P 500 Stock Index is a widely recognized capitalization-weighted index of 500 common stock prices in U.S. companies.
A basis point, or bp, is a common unit of measure for interest rates and other percentages in finance. One basis point is equal to 1/100th of 1%, or 0.01% (0.0001).
U.S. Global Investors, Inc. is an investment adviser registered with the Securities and Exchange Commission ("SEC"). This does not mean that we are sponsored, recommended, or approved by the SEC, or that our abilities or qualifications in any respect have been passed upon by the SEC or any officer of the SEC.
This commentary should not be considered a solicitation or offering of any investment product.
Certain materials in this commentary may contain dated information. The information provided was current at the time of publication.
 Frank Holmes is the CEO and Chief Investment Officer of U.S. Global Investors. Mr. Holmes purchased a controlling interest in U.S. Global Investors in 1989 and became the firm’s chief investment officer in 1999. Under his guidance, the company’s funds have received numerous awards and honors including more than two dozen Lipper Fund Awards and certificates. In 2006, Mr. Holmes was selected mining fund manager of the year by the Mining Journal. He is also the co-author of “The Goldwatcher: Demystifying Gold Investing.” Mr. Holmes is engaged in a number of international philanthropies. He is a member of the President’s Circle and on the investment committee of the International Crisis Group, which works to resolve conflict around the world. He is also an advisor to the William J. Clinton Foundation on sustainable development in countries with resource-based economies. Mr. Holmes is a native of Toronto and is a graduate of the University of Western Ontario with a bachelor’s degree in economics. He is a former president and chairman of the Toronto Society of the Investment Dealers Association. Mr. Holmes is a much-sought-after keynote speaker at national and international investment conferences. He is also a regular commentator on the financial television networks CNBC, Bloomberg and Fox Business, and has been profiled by Fortune, Barron’s, The Financial Times and other publications. Visit the U.S. Global Investors website at http://www.usfunds.com.
More from Silver Phoenix 500


