Our Custom Index Charts Suggest The Markets Are In For A Wild Ride


Over the past week, our members have been emailing us and asking us “what's going to happen next” and “any updates on the move in metals and the US stock markets”. With this incredible downside move prompted by the US Fed and the US/China trade talk failure, it certainly appears that the markets are poised for something big and dramatic.
We dove into our custom indicator charts to try to get a better gauge of the current market environment and to help illustrate that our research team has been all over this move for months. Before we get started, we want to urge our followers to read the following research posts :
July 16, 2019: FINANCIAL CRISIS BEAR MARKET IS SCARY CLOSE
July 8, 2018: PART III – DEBT CRISIS TO BE REBORN IN 2020
June 18, 2019: FED MAY TRIGGER WILD SWING IN INDEX AND METALS
It is critically important that you read our earlier research posts to understand exactly what is happening in the markets right now. Capital is shifting away from risk in foreign markets, emerging markets, and currencies and into safety in the US, Canada, Japan, and other more mature markets. A huge amount of capital has already been pulled away from the global equities markets (including the US stock market) while everyone waits to see how this next move is going to play out.
This creates very low liquidity in the global markets (similar to when the Flash-Crash happened) and this lack of liquidity can prompt very big, volatile moves in price. For skilled technical traders, this is a dream come true – some of the biggest price swings we'll likely see over the next 4- years are about to unload on us and we need to be prepared to profit from these moves.
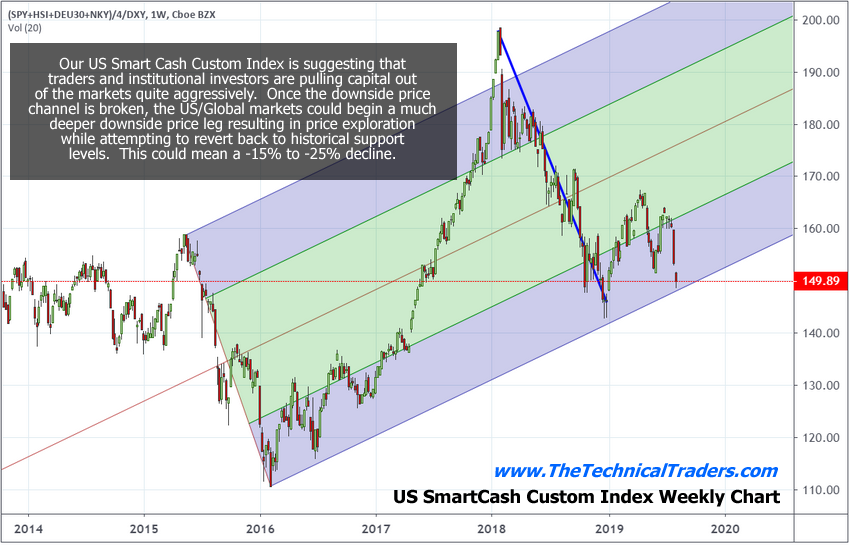
Custom Smart Cash Index - Weekly Chart
Our first custom index chart is what we call the Smart Cash custom index. This measures the amount of capital deployed in the markets by tracking various global instruments and weighing them by the value of the US Dollar. This chart highlights that since the peak in January 2018, the true value of the global market has been deteriorating quite extensively and that we are very close to breaking the lower price channel created by the 2015 to 2016 price range rotation (the pre-2016 US Presidential election price rotation).
If and once this lower price channel is broken, we believe a global stock market crash will follow that could easily be prompted by a collapse in China, Asia, and Europe as defaults and shadow banking issues rise up to destroy confidence. Ultimately, we believe the US stock market will recover from this move fairly quickly (likely in late 2019 or early 2020) as the value will migrate to safety (think US, Canada, Japan, UK, Swiss and possibly a few others). Capital is always seeking the best returns in the safest investment environment possible – so don't forget about Gold and Silver.
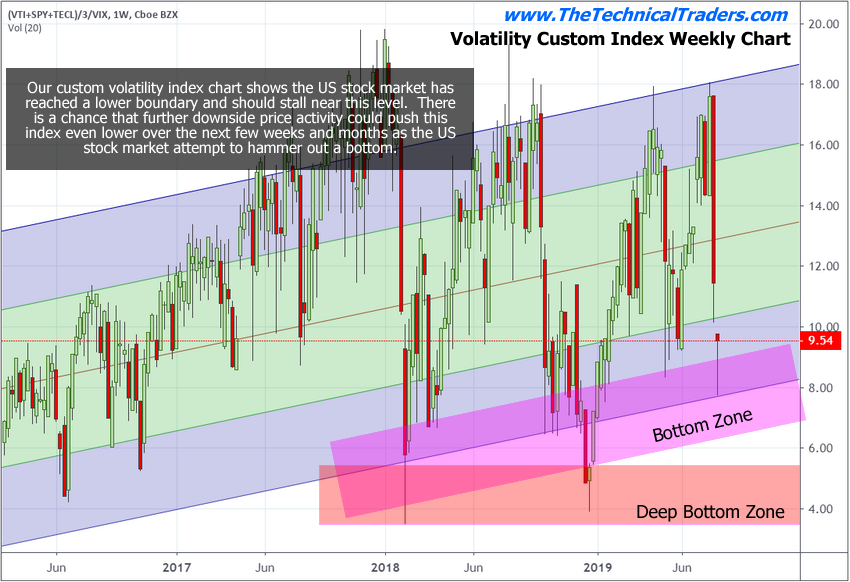
Custom Volatility Index - Weekly Chart
This next custom index chart is our Custom Volatility Index data. We use this to gauge how tops and bottoms are forming and when price becomes overvalued or undervalued. You can see from this chart that we've highlighted the BOTTOM zone and the DEEP BOTTOM zone. These are areas where the Custom Volatility Index will reach when the price is establishing a bottom (typically). The one thing we have to consider is that price could STAY near these lower levels as lower prices continue and/or as a deeper price bottom is hammered out. There is no reason why price must bottom near these lower levels – it just typically does bottom near these levels in an uptrend.
If the trend changes to a bearish trend, then we would expect the Custom Volatility Index chart to crash into the DEEP BOTTOM zone and stay there as the price continues to collapse.
Notice how prices have recovered recently in the US stock market after the Custom Volatility Index chart reached the lower price channel and recovered? This is exactly what we expect to happen in an uptrend. So, right now, we can confirm that the Custom Volatility Index is acting as if the Bullish trend is still intact and that we may continue to see some type of further price recovery over the next few days or weeks.
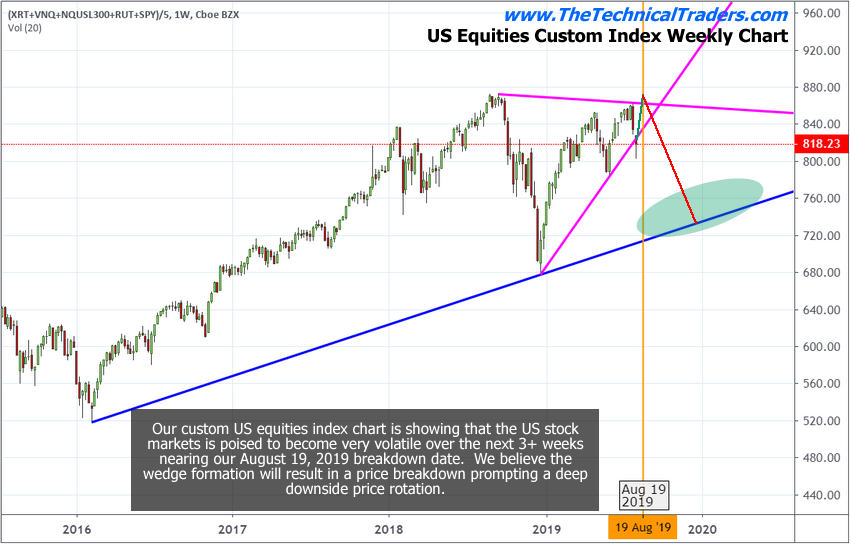
Custom Market Prediction Price Range - Weekly Chart
This brings us to the last Custom Index chart, the US Equities Custom Index Chart. Pay very close attention to the lines drawn on this chart and please stop and read our past research posts (above) to really gain an understanding of what is happening in the markets.
Right now, we expect a “reversion recovery” in the US stock market to push prices back to the upside over the next 7 to 10 days. Just prior to August 19, 2019, we expect a bit of a “rollover” to take place in the US stock market. This could happen at new all-time highs for some instruments.
After that rollover takes place, we reach the apex of the Flag/Pennant formation, near August 19 or shortly after this date, and this is where we believe the breakdown in price will begin.
We believe price will “unhinge” at or near this date and this action could be related to some external factor (global central banks, Asia/China, European Union or some other catalyst events) that will prompt a massive volatility spike and prompt a downside market move that could result in a -15% to -25% downside price collapse.
Our first objective, highlighted on this chart, shows you what we believe is the highest probability outcome. Yet we will caution you that our predictive modeling system is suggesting this downside move will set up one of the biggest “price anomaly” patterns of the year for traders. This setup should complete near November/December 2019 as a bottom in price is found and a renewed upside price leg begins in the US markets.
We have more exciting proprietary trading indicators coming soon here as well that you can use to profit each week from the markets.
Concluding Thoughts:
We are urging you to pay attention to our research and to visit www.TheTechnicalTraders.com to learn how we help our members find and execute better trades. If you've been following our work/research, you already know we've been calling these move over the past 20+ months with incredible accuracy. We've called moves 10 to 12 months in advance that have played out almost perfectly for our members.
Right now, you want to protect your investments. Protect your 401K and retirement accounts by moving your investments into Utilities, Cash, Inverted S&P instruments and precious metals. Stay away from high growth Asia, Emerging Market, European or technology firms till early 2020 when it should be safe to reinvest in these instruments.
Volatility is going to skyrocket over the next few months. The VIX may print a price above 45 or 50 at some point within the next 60 to 90 days. If you don't believe me, then stick with your current investments and ride it out (good luck). Our estimate is that we have less than two weeks before the August 19 breakdown date.
If you want my daily pre-market video analysis so you know exactly what to expect each and every day with stocks, metals, miners, and oil, plus get my ETF trade alerts complete with entry, targets, and stop prices subscribe now to my Wealth Building Newsletter and get a free silver or gold bar!.
********

Chris Vermeulen has been involved in the markets since 1997 and is the founder of Technical Traders Ltd. He is an internationally recognized technical analyst, trader, and is the author of the book: 7 Steps to Win With Logic
Through years of research, trading and helping individual traders around the world. He learned that many traders have great trading ideas, but they lack one thing, they struggle to execute trades in a systematic way for consistent results. Chris helps educate traders with a three-hour video course that can change your trading results for the better.
His mission is to help his clients boost their trading performance while reducing market exposure and portfolio volatility.
He is a regular speaker on HoweStreet.com, and the FinancialSurvivorNetwork radio shows. Chris was also featured on the cover of AmalgaTrader Magazine, and contributes articles to several financial hubs like MoneyShow.com.
More from Silver Phoenix 500


