Palladium Price Forecast


Let’s analyse the technicals of Palladium taking a bottom up approach beginning with the weekly chart.
PALLADIUM WEEKLY CHART
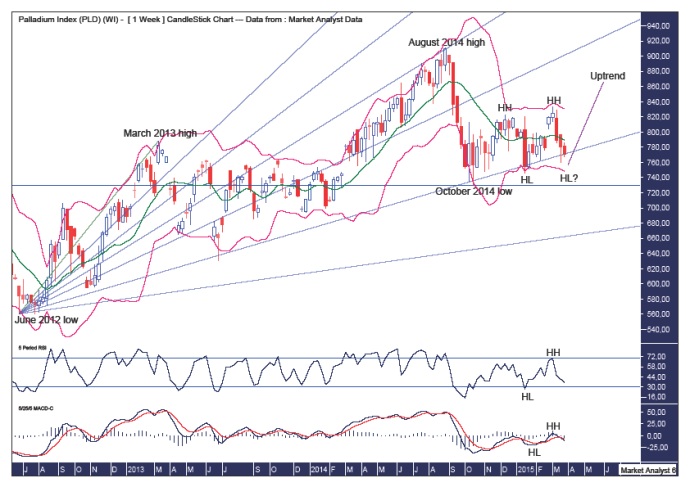
I have drawn a Fibonacci Fan from the June 2012 low to March 2013 high which has shown some very nice symmetry with price including the 50% angle providing resistance at the August 2014 high and the 76.4% providing support at the October 2014 low. Price looks to be still finding support at this 76.4% angle.
The Bollinger Bands show price bouncing up and down between the upper and lower bands and price now looks headed for the lower band and I favour support to come in there again.
Since the October 2014 low at US$729 there has been a pattern of higher highs and higher lows suggesting a bull trend. I am looking for this current move down to put in another higher low before the uptrend really gets goings.
One possibility is the coming low makes a bullish double bottom with the trend. That would involve a low around the previous higher low which was set in January 2015 at US$746.
Breaking down below the October2014 low, denoted by the horizontal line, would likely mean the bull trend is over but I don’t favour that scenario.
The lower indicators, being the Relative Strength Indicator (RSI) and Moving Average Convergence Divergence (MACD), are both showing a pattern of higher highs and higher lows which give me confidence price will shortly launch higher again.
Let’s move on to the monthly chart.
PALLADIUM MONTHLY CHART

I have drawn an Andrew’s Pitchfork which shows price has been trending up within the upper channel with a couple of false breaks above the top trend line. This clearly shows a “three strikes and you’re out” top formation in play with the third strike high still to come. I favour the third high to be right at resistance from the top trend line and a marginal false break high of the second strike high. Let’s see.
A third high looks set to be accompanied by a fourth bearish divergence on the RSI and a third bearish divergence on the MACD indicator. One might expect that to lead to a significant decline. Time will tell.
I have drawn a Fibonacci Fan from the 2001 high to 2008 low and I am looking for the 88.6% angle to provide resistance. The second strike high was just under resistance from this angle and I favour the third and likely final high to be a marginal false break of this angle.
I have added moving averages with time periods of 50 (blue), 100 (red) and 200 (black) which is evidence of the solid bull trend in play with the blue line above the red line which is in turn above the black line. And once the expected correction takes place perhaps the final low will be at support from one of these averages with the red and black lines ones to watch.
Another potential correction ending level will be at support given by the lower pitchfork trend line. All in good time.
Let’s wrap up the analysis by looking at the big picture yearly chart.
PALLADIUM YEARLY CHART
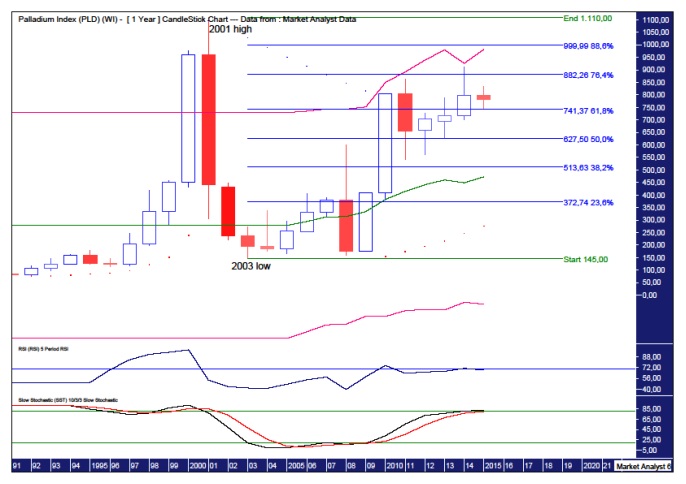
The RSI and Stochastic indicator are around overbought territory so perhaps a correction is not far away.
I have added Bollinger Bands which show last year’s high was a smidgeon below the upper band. I’d like to see price have another crack at reaching that upper band which currently stands around US$980.
I have added Fibonacci retracement levels of the move down from 2001 high to 2003 low and price has already clipped the 76.4% level so the next target is the 88.6% level at US$999 but I suspect price will fall just short of that level.
The Parabolic Stop and Reverse (PSAR) indicator has a bullish bias with the dots underneath price and I expect the next major low to hold above that support.
Summing up, the short term looks positive for price before a significant correction takes place. We can investigate likely correction ending levels further down the track once the next high has been confirmed.
********
My website is www.thevoodooanalyst.com
© 2014 Copyright The Voodoo Analyst - All Rights Reserved
Disclaimer: The above is a matter of opinion provided for general information purposes only and is not intended as investment advice. Information and analysis above are derived from sources and utilising methods believed to be reliable, but we cannot accept responsibility for any losses you may incur as a result of this analysis. Individuals should consult with their personal financial advisors. Put simply, it is JUST MY OPINION.
More from Silver Phoenix 500


