Persistent Bull


A month ago the market seemed to be setting up for an intermediate-term correction.
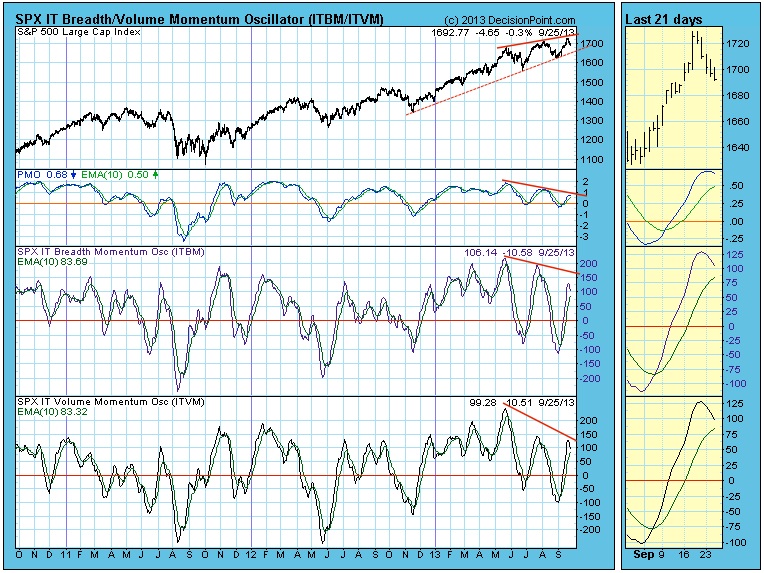
On the month-old chart below we can see a bearish rising wedge accompanied by negative divergences in price, breadth, and volume. Our comments at the time: "We expect the SPX to correct down to the rising trend line drawn from the November 2012 price low. The condition of the intermediate-term indicators suggests that that support may not hold this time around."
Referring to the most recent chart below, as it turns out, we were right to the extent that the SPX corrected down to the rising trend line and broke down through it as well; however, the larger scale correction we were expecting did not materialize, and prices rallied again to the top of the rising wedge. We naturally wonder how the rising wedge will eventually resolve.
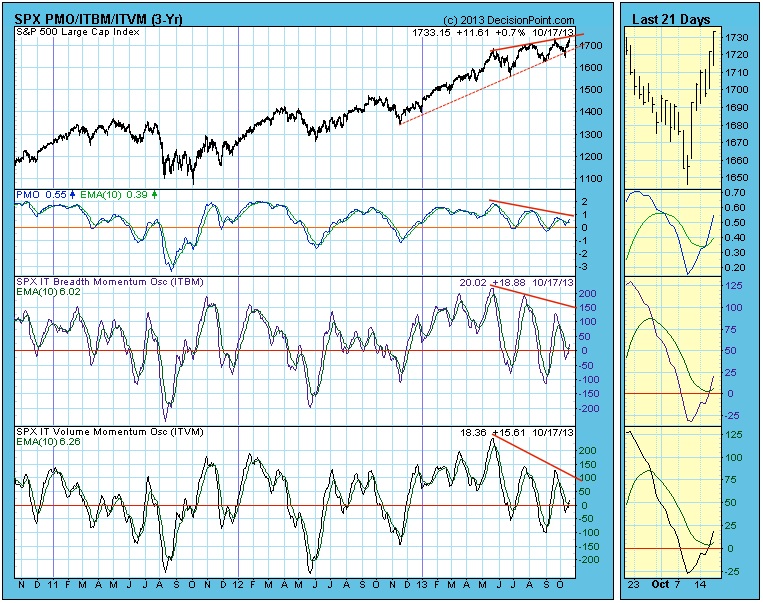
We note that the three prior price tops were associated with corresponding overbought indicator tops; whereas, currently the indicators are solidly in the neutral zone, leaving plenty of room for them to accommodate rising prices.
The more immediate problem for rally continuation is that short-term indicators are at very overbought levels, so a pause/pullback in that time frame is possible.
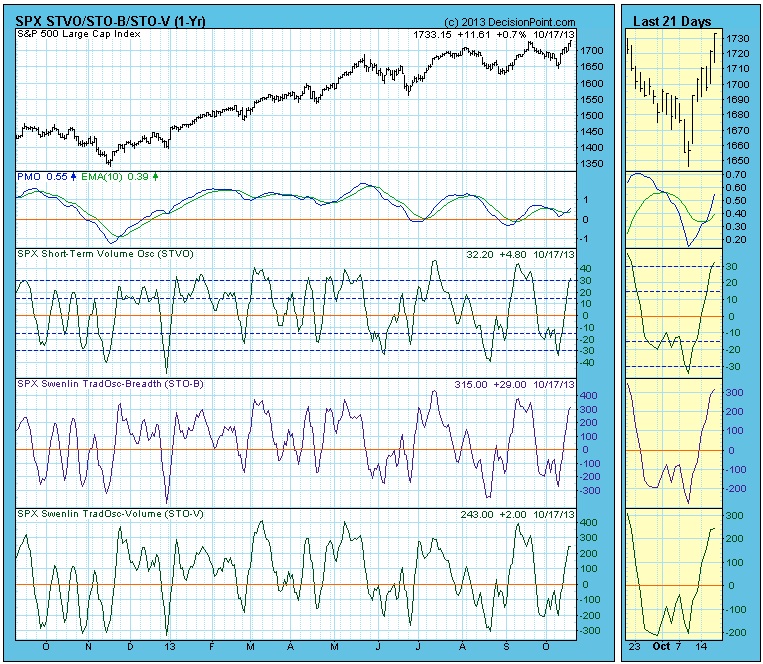
Conclusion: The SPX has run into overhead resistance and short-term indicators are overbought. This could initiate another trip to the bottom of the wedge formation. However, intermediate-term indicators, which carry more weight, favor a continued rally, so we remain bullish overall. That outlook would change if prices were to correct enough to cause the intermediate-term indicators to turn down.
* * * * * * * * * * * * * * * * * * * * *
Technical analysis is a windsock, not a crystal ball.
More from Silver Phoenix 500


