A Precise Forecast For The Coming Blowoff In Crude


Considering the size of the crude-oil market and its geopolitical importance, the rally begun two years from $6.50/bbl amidst fears of a Covid-caused Depression ranks as one of the most spectacular and consequential in history. Consumers are coping at the moment with speculative excesses brought on by the curtailment of Russian petrofuels, and by disruptions, real or feared, in the global distribution network for energy. Pump prices have doubled since the pandemic began, piling crushing weight on a U.S. economy that was already close to buckling from steep increases in the cost of nearly everything. How much higher can prices go? The headlines suggest there is no relief in sight. But an end to the cost spiral is surely coming, since the parabolic rallies in many commodities, particularly oil, grains and metals, are too steep to sustain.
When the wilding spree ends and prices fall as precipitously as they have risen, the result will be a deflationary bust that will send the global economy into deepest recession or even Depression. Oil cannot but lead the way down, since its collapse will be exacerbated by the vast swath of the energy patch that has been hocked to financiers in order to propagate growth in derivatives markets that are much larger, even, than the oil sector. I referred to this effect as a 'double whammy' in my last commentary, which was titled Inflation's Last Fling.
Here's the Trade...
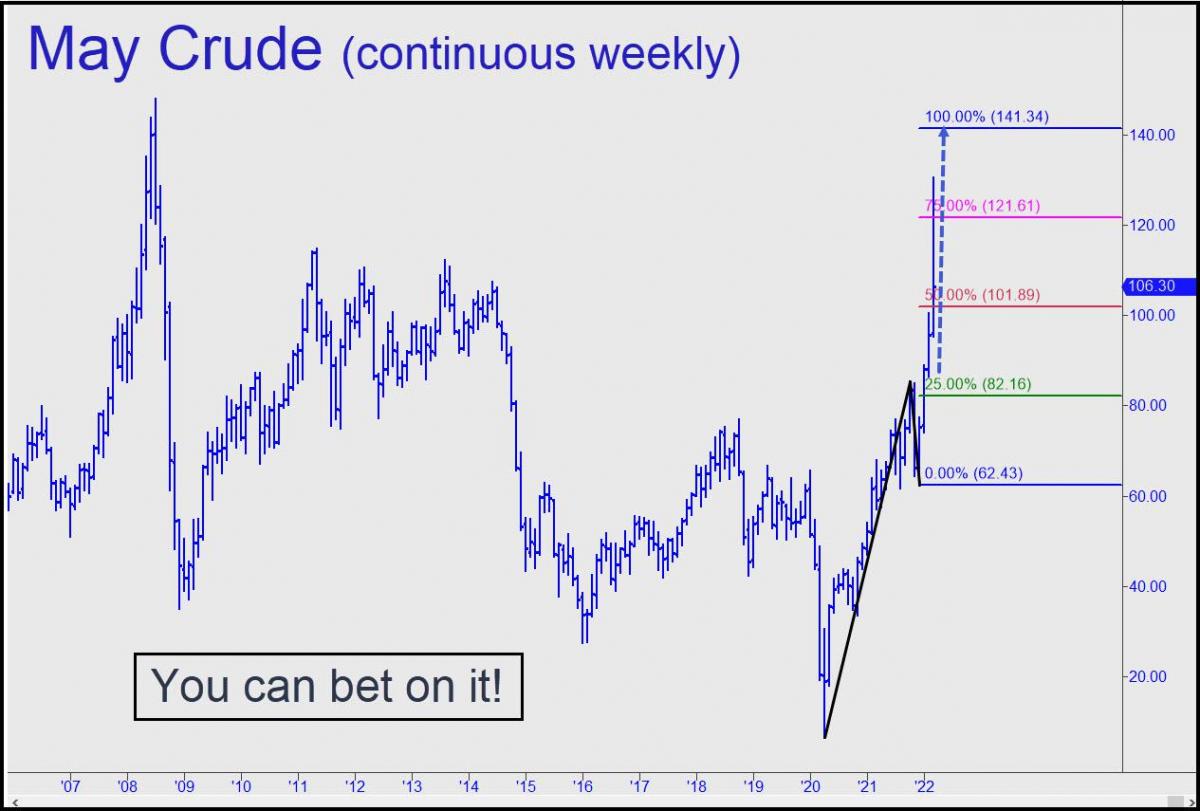
So where might crude's rally reverse, popping an asset bubble that has been building for more more than three decades? The chart above makes a persuasive case for a bull-market top at $141. That would represent an 8% gain over this month's so-far peak at 130.50, and a 3.3% gain over the current $106. The May contract shown may need to correct for a few weeks or longer before the blow-off rally can begin, but there can be little doubt that it will reach a minimum 141. Under the rules of the Hidden Pivot Method, this can be inferred from the ease with which buyers blew past the red line, a 'midpoint resistance' at 101 that is often useful, if not to say infallible, in determining trend strength. The chart also suggests that a pullback to the green line ($82) would offer an extraordinary opportunity for bulls to get aboard 'mechanically' for one last, spectacular ride.
********
More from Silver Phoenix 500


