Present Position Of The Markets


 Current position of the market
SPX: Long-term trend – Bull Market
Intermediate trend – While everything technical points to an overbought condition which should require an adjustment, the exact timing of that correction is for the market itself to decide and reveal.
Analysis of the short-term trend is done on a daily basis with the help of hourly charts. It is an important adjunct to the analysis of daily and weekly charts which discusses the course of longer market trends.
HIGH LEVEL LEVITATION
Market Overview
For the week, SPX closed at a new high -- three points higher than the previous week but remaining within the Fibonacci cluster zone which extends a little higher. Strong indexes made new highs, while weaker ones did not. It’s still a mixed bag and a question of whether the strong will uplift the weak a little longer or the weak will start pulling down the strong. In addition, the index is up against some stiff resistance which will be discussed a little later.
There are also indications that we are reaching another short-term high with a minor decline due next week, perhaps similar to the one of a week ago. Since this will correspond to another short-term cycle bottom, what happens next should give us some insight into how much longer this deceleration process will continue.
Last week I alluded to the fact that we could be witnessing the beginning of the 7-year cycle topping pattern. If so, increasing pressure should be felt by prices every passing week.
Momentum: The weekly MACD continued to edge up with negative divergence. The SRSI angled over slightly last week. The daily MACD has made a bearish cross but remains strongly positive, while the SRSI has gone negative.
Breadth: The McClellan Oscillator has now joined the SRSI in negative territory. This has arrested the climb of the Summation index.
Structure: (unchanged) Probably still in primary wave 3. It remains within the confines of its intermediate channel.
Accumulation/distribution. Short-term: Another small distribution pattern is forming on the 1X P&F chart. Long-term: A small distribution pattern has also started to form on the 3X chart.
XIV: Continues to be positive short-term while remaining negative intermediate term.
Cycles: A short-term cycle is due next week.
Should the start or rounding top formation continue, it will suggest that the 7-yr cycle is in the process of topping.
Chart Analysis
We start with the weekly SPX (chart courtesy of QCharts, including others below) with the McClellan Summation Index posted underneath it.
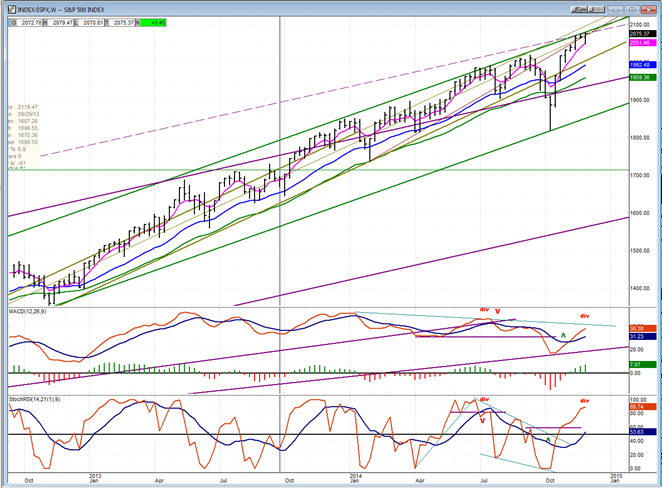
For the third week in a row SPX has bumped its head against the top of its intermediate (green) channel. That channel probably represents primary wave III of the bull market which shows little weekly deceleration, although this is more visible on the daily chart. With the intermediate trend’s ability to rise so far above the major trend channel (purple) it is obvious that the top of the bull market is still months, if not years, away. That does not mean, however, that we cannot have a strong intermediate correction when primary wave III comes to an end. Our analysis should therefore focus on indentifying an intermediate top.
Warnings are inceasing every week, but they do not affect the market universally as some segments are still exhibiting stength, while others are more ready to take a rest and appear to be patiently waiting for the few remaining dissenters to join them. Some of these signs appear in the weekly chart of the SPX but, before I point them out, let me discuss an important aspect of this chart. It has to do with the seemingly inpenetrable resistance at which the index finds itself. Every one of the trend and channel lines that you see converging on the current time frame is a valid resistance line. At the same time, we have also reached a cluster of Fibonacci projections all targeting a very narrow band in this price range. P&F targets which tend to confirm Fibonacci measurements are also in agreement.
If there is such a strong resistance band at this level, the market should, at a minimum, spend some time consolidating before going through it. If, on the other hand, it is as inpenetrable as it seems, the SPX could decide that this is as good a place as any to end primary wave III and start wave IV. We have some hints that it is at least thinking about it.
I have already mentioned that the index has now made three separate but unsuccessful attempts to rise above its intermediate top channel line. This should start to show in the weekly price oscillators, with an emphasis on “start”. First of all, one would expect negative divergence to show in both MACD and SRSI, and it does. Next, it should become visible in the oscillators themselves, and it is! The SRSI has visibly started to angle over and, less perceptible, the MACD histogram has slowed its rate of ascent. This trend should become far more obvious in the weeks ahead.
This incipient weakness is far more noticeable in the McClellan summation index, below. That should not be a surprise since breadth is normally where warnings first appear. Over the past 18 months, NYSI has been making a series of lower tops. Even more important, the last advance (which, by the way, started from a lower low) appears to have peaked. Both the RSI and the MACD have turned down although, to be objective, the fact that these indicators did overcome their former short-term peaks could mean that any substantial decline will require more preparation -- perhaps several weeks!
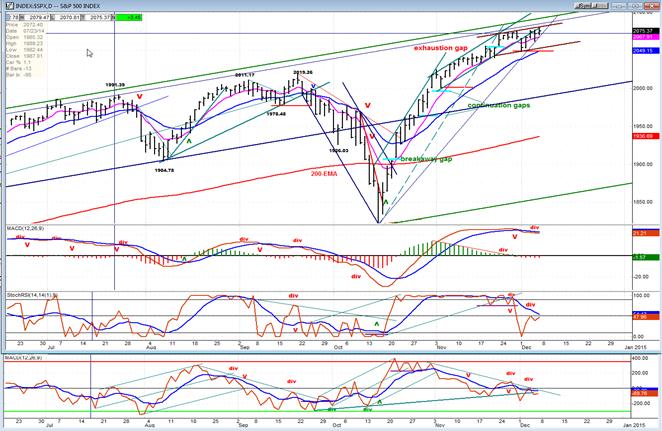
When analyzing the daily SPX chart, we can see that the warning signs which appear to be just starting on the weekly chart, are more advanced though by no means decisive, yet! On this chart, for the sake of clarity, I have omitted to show all the resistance lines that I drew on the weekly chart. Instead, we’ll focus on the various channels drawn from the 1820 level.
The first one is very steep, but eventually evolves into another channel which rises at a more normal rate of ascent. It too evolves into another channel which is barely pointing up and which represents significant deceleration in the uptrend but, since that last channel is only a couple of weeks old (and still rising) we’ll need to see if it continues for a longer period of time, or eventually turns into a trend reversal. In order to do that, it would have to not only come out of the lower channel line, but also drop below the red horizontal line. Until this happens, we could see prices continue to rise higher in small increments into the resistance zone.
I have left in place the indicated gaps to show that the exhaustion gap could still prove to define the last hurrah for the trend. Prices closed the gap last week, but did not follow through on the downside. There is no rule that says that they must do so immediately and perhaps the index will continue to extend the distribution pattern which it appears to have started and which requires more definition on the 3X chart before it can qualify as an important top.
The SRSI and breadth index have both gone negative and rebounded while remaining minus, but the MACD, even though it has made a bearish cross, has a long ways to go before it drops below the zero line. This suggests that while a top appears to be building, it will most likely take some time before we are ready for the beginning of a protracted decline. In the meantime, the market is likely to continue frustrating the bulls and the bears alike.
On the hourly chart, the last channel of the decelerating uptrend from 1820 is much clearer. I have identified two short-term tops (the second one about to be complete) which, so far, form a larger top.
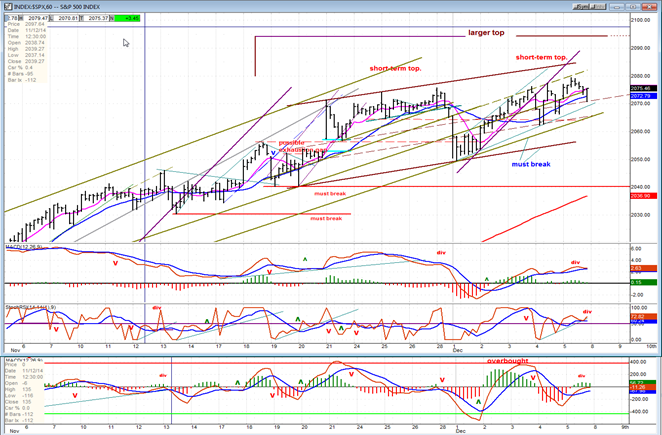
It would be ideal if, after a short decline to complete the second pattern, a third would form; possibly carrying prices even a little higher. That would most likely complete the larger formation. Things often happen in threes in the stock market. It also seems to fit the cyclical pattern.
Getting back to the second short-term pattern, if it has not already seen its high, it could do so on Monday before rolling over. A decline roughly similar to that of the first pattern should take place. There is also a good chance that, if it is going to be the third and last short-term pattern of the series, the index will break below the bottom channel line before finding support.
All three oscillators are showing negative divergence and two are already starting to roll over. That should place the short-term top at some time during Monday’s session.
Sentiment Indicators
I had not looked at The SentimenTrader (courtesy of same) for the whole week but was not surprised that the long-term indicator had jumped to 68. This is a negative for the bulls and a plus for the bears.
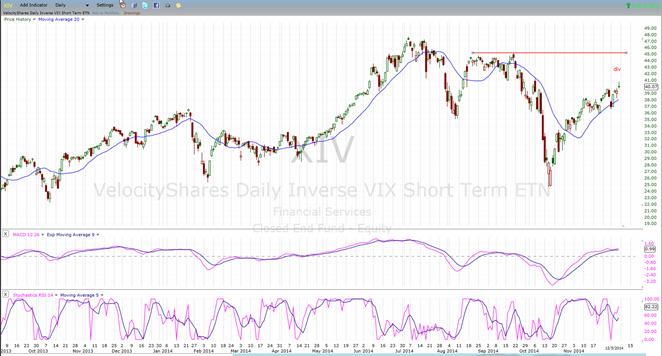
XIV (Inverse NYSE Volatility Index) - Leads and confirms market reversals.
XIV has continued to move up with the SPX, indicating that we may not be quite ready for an important reversal although, judging by the long-term significant divergence it’s a matter of when, and not if. The final high of the SPX is likely to be when XIV no longer follows it to a higher high.
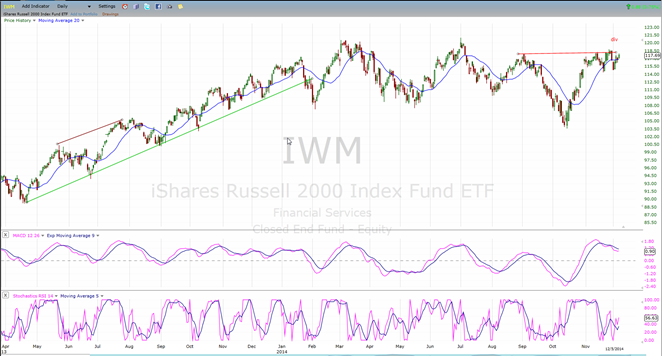
IWM (iShares Russell 2000) - Historically a market leader.
Russell has stopped short of overcoming its former high and seems to be waiting for the market to roll over. When the latter does reverse, IWM should be one of the leaders on the downside.
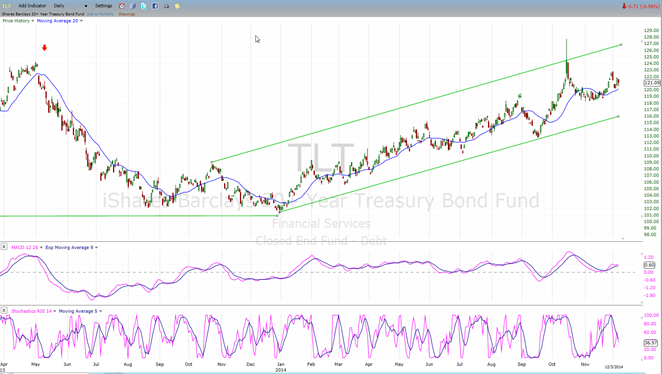
TLT (20+yr Treasury Bond Fund) – Normally runs contrary to the equities market.
TLT is holding on to its gain but seems reluctant to make further progress. We need to wait until it clarifies its current ambivalence.
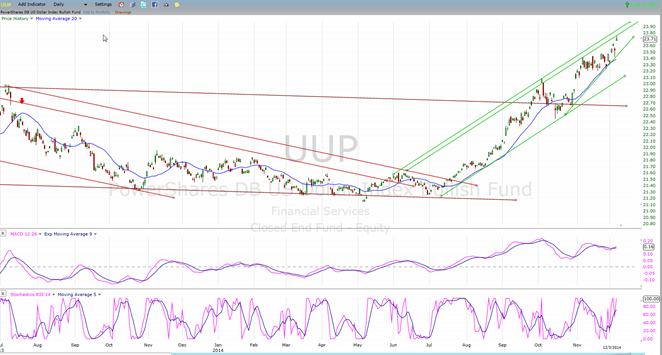
UUP (dollar ETF)
UUP has pushed a little higher but may not go any farther without consolidating. It has now reached the top of its channel and this should offer some resistance to higher prices. It may also have completed a 5-wave move from the low.
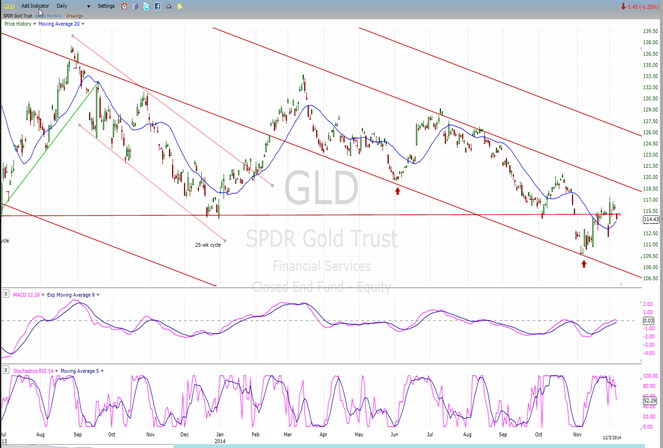
GLD (ETF for gold) – Runs contrary to the dollar index.
GLD has been temporarily restrained by the continued strength in UUP. It should be on its way up again when the latter starts to consolidate.
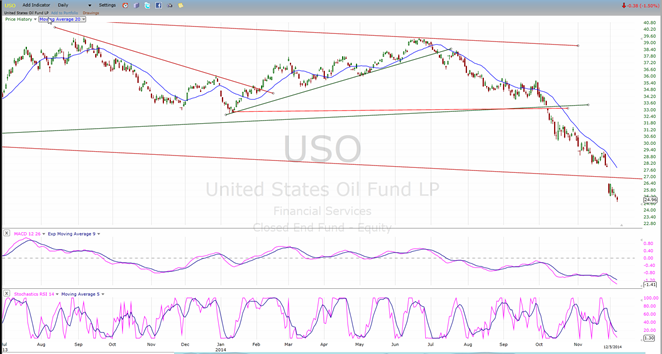
USO (US Oil Fund)
As long as oil keeps making lower lows, so should USO. Since there is no sign of bottoming in the MACD, this could continue for a while longer.
Summary
SPX has reached an area of strong resistance which is reinforced by a cluster of Fibonacci targets. As a result, it would not be logical to expect much more price appreciation in this index. That does not mean that we can expect a significant correction to occur imminently. More distribution at this general level is likely over the next few weeks, probably taking the form of a rounding top.
It is inarguable, however, that warnings of an important top continue to increase. Last week, the SentimenTrader notched up to a reading equivalent to the one it gave in September. The cause of the deceleration process which is taking place is probably the topping of the 7-year cycle which is slated to make its low in late 2015.
FREE TRIAL SUBSCRIPTON
Market Turning Points is an uncommonly dependable, reasonably priced service providing intra-day market updates, a daily Market Summary, and detailed weekend reports. It is ideally suited to traders, but it can also be valuable to investors since highly accurate longer-term price projections are provided using Point & Figure analysis and Fibonacci projections. Reversal estimates are obtained from cycle analysis, an increasing use of EWT for structural analysis, and a thorough understanding of conventional technical analysis
For a FREE 4-week trial, send an email to: info@marketurningpoints.com
For further subscription options, payment plans, weekly newsletters, and for general information, I encourage you to visit my website at www.marketurningpoints.com. By clicking on “Free Newsletter” you can get a preview of the latest newsletter which is normally posted on Sunday afternoon (unless it happens to be a 3-day weekend in which case it could be posted on Monday).
The above comments and those made in the daily updates and the Market Summary about the financial markets are based purely on what I consider to be sound technical analysis principles. They represent my own opinion and are not meant to be construed as trading or investment advice, but are offered as an analytical point of view which might be of interest to those who follow stock market cycles and technical analysis.

When Andre Gratian was a stock broker years ago, a friend introduced him to technical analysis of the market. Consequently, it is not an exaggeration to say that Andre fell in love with this approach! Ever since then, it has become an increasingly important part of his professional life. Gratian has studied the works of Wyckoff, Edwards & Magee, Edward J. Dewey (cycles) and many others. However, one of my most profitable undertaking has probably been to study Point & Figure charting, which he finds invaluable in analyzing stocks and indices. If he were restricted to one methodology, this is the one that he would choose. This well-rounded background has given him what he feels to be a special insight into the stock market, facilitating the recognition of meaningful patterns and the ‘turning points’ in all trends, whether they be short or long term. Andre feels very comfortable discussing the stock market and passing on meaningful information to others. His subscribers include individuals and money managers throughout the world. Moreover, his Newsletters are currently published on several financial sites, here and abroad.
More from Silver Phoenix 500


