QE Didn't Cause Inflation And The Fed Taper Won't Quell Rising Prices


A government generally has two “levers” it can pull, to help get its economy back on track after it has fallen into a recession and/or is posting abnormally low economic growth.
Monetary policy refers to the actions of central banks to achieve macroeconomic policy objectives such as price stability, full employment and stable growth.
Fiscal policy encompasses the power of the federal government to tax and spend. In the United States, fiscal policy decisions are made by the Congress and the administration; the US Federal Reserve, or central bank, plays no role in this regard.
The Fed is responsible for setting monetary policy and it is supposed to be free of political interference from Congress or the executive branch. The US President appoints the Federal Reserve Chair and its seven-member board of governors, whose positions are then confirmed by the Senate.
All the board members serve on the Federal Open Market Committee (FOMC), which meets eight times a year to set monetary policy.
The Fed has a dual mandate of establishing maximum employment and price stability; the latter normally allows for 2% inflation. Its main policy tool is the federal funds rate, giving the Fed control over the rate that banks charge each other for short-term loans. By adjusting the level of short-term interest rates, the Fed can influence longer-term rates, thus changing the financial conditions that can affect the spending decisions of households and businesses. Read more about the Fed
When it comes to controlling inflation, the distinction between fiscal and monetary policy is important because one of the levers — fiscal policy — is far more likely to cause inflation than the other. And while the Fed has been saying that “the taper” (shorthand for a gradual end to the massive bond-buying program it unleashed in early 2020) that started in November is a precursor to cutting interest rates sometime next year, the reality is that the previous Fed “taper tantrum” in 2013 had virtually no impact on inflation, nor did “quantitative easing” cause inflation as it was expected to during the first rounds of QE between 2008 and 2014.
The Fed is currently caught between a rock and a hard place, to quote a well-worn phrase. The only way to tame the current out-of-control US inflation which at 6.8% is growing the fastest since 1982, is to raise interest rates, but the Federal Reserve is highly constrained in how much it can hike rates due to its monstrous national debt, which at last count has surpassed $29 trillion. This is the dilemma the Fed and US policymakers must contend with as 2021 draws to a close.
QE 2008 vs 2020
In 2008 in response to the financial crisis which started in 2007, the Fed tried a radical new program called quantitative easing. The idea behind QE, as it was soon shortened to, was to “goose the economy” through the purchase of bonds. The Fed realized that cutting short-term rates close to 0% wasn’t enough to stop the US economy from freefalling, so it began buying long-term bonds (and mortgage-backed securities). Adding to the demand for long-term bonds lowered their yields. QE was designed as a way to inject liquidity into the financial system by getting banks to make more loans.
Eventually QE caught on, and it was adopted as monetary policy by the Bank of England (BOE), the Bank of Japan (BOJ) and the European Central Bank (ECB).
Critical to an understanding of today’s inflation dilemma and what can (and can’t) be done about it, is to appreciate that the quantitative easing of 2008-14 is quite different from that of 2020-21.
To fight the Great Recession, the Fed began “printing money” (actually they just added it on a computer screen, but the effect was the same). Between 2008 and mid-2014 the Fed increased their balance sheet from $800 billion to $4.5 trillion, thus helping to recapitalize banks that were in danger of going bankrupt, and restoring confidence in the economy.
But most of the new money never made its way into the economy; it stayed within the banks and much of it wasn’t even leant out. We therefore didn’t see any real inflation. In fact during this time inflation averaged about 1.6% a year, below the Fed’s 2% target.
Once the pandemic started in early 2020, the Federal Reserve resumed quantitative easing at a torrid pace, within weeks printing $3 trillion and again lowering interest rates to 0%.
The key difference between QE from 2008 to mid-2019, “quantifornication” I like to call it, and now, is that the Federal Reserve has been buying up US government debt (Treasuries) to fund a massive amount of government spending and is therefore adding to the national debt currently sitting at $29T.
US politicians since 2020 have been willing to spend whatever it takes to get the economy moving again and to maintain a bullish stock market that has kept rising for over a decade. First there was the $2.2 trillion CARES Act passed by then-President Trump. It was followed in early 2021 by President Biden’s $1.9 trillion covid relief bill.
All of this pandemic-related spending has dramatically increased the “M2” money supply, shown below.
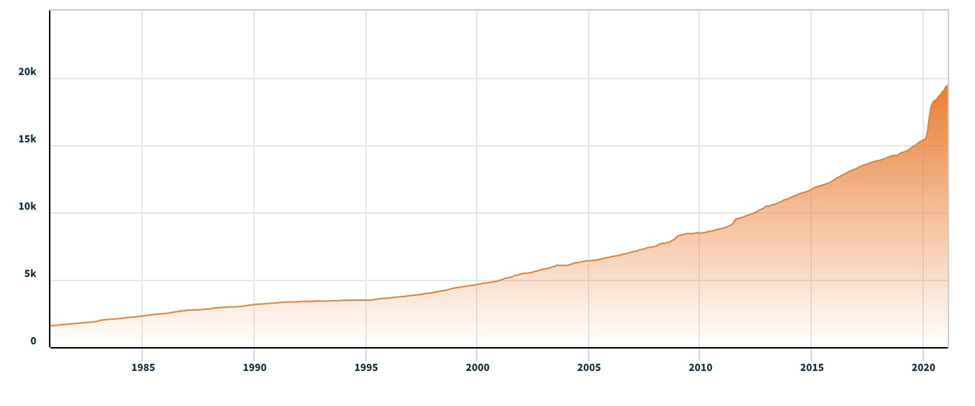
M2 money stock. Source: Nasdaq
From March 2020 to November 2021, the Fed more than doubled its balance sheet to $8.7 trillion. The central bank raised its monthly bond purchases to $120 billion in December 2020, saying that the pace would continue until there was “substantial further progress” in the economic recovery.
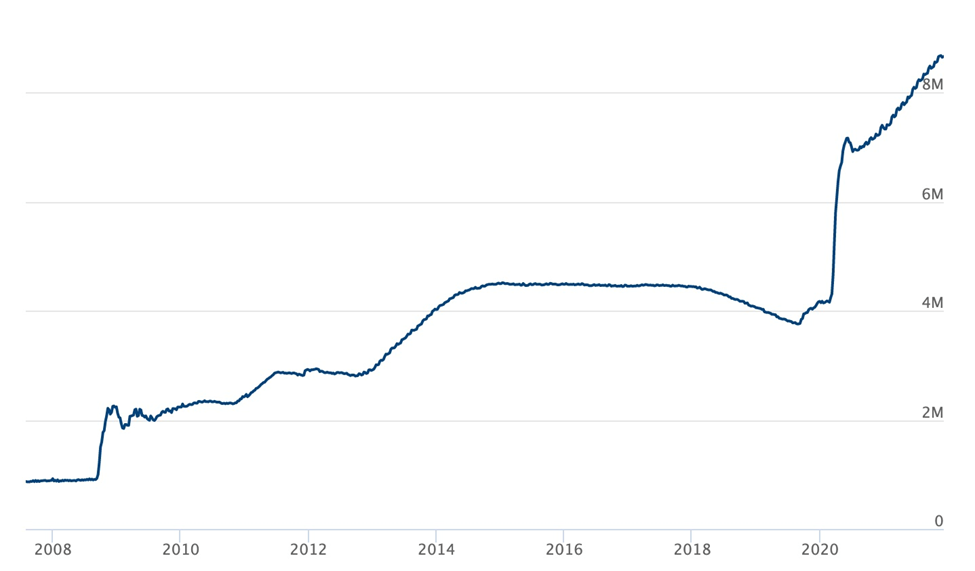
The Federal Reserve’s balance sheet. Source: US Federal Reserve
The federal government too has demonstrated its willingness to “do anything” to get an economic recovery and that has included sending stimulus checks, aka “stimmies” to individual Americans. The IRS has reportedly issued more than 169 million payments in the third round of direct stimulus aid, and there is a possibility of a fourth round. In all, eligible adults have so far received $3,200, including $1,200 in March 2020, $600 in December 2020 and $1,400 this past March.
Doing some quick math, if 169 million Americans received all three stimulus checks, that comes out to $540,800,000,000, or roughly half a trillion dollars. Only counting the $1,400 third payment amounts to 236 billion, 600 million dollars.
In 2008 regular people received no such payments, in fact the main recipients of US government generosity were the banks and large US corporations. According to MIT, the direct cost of the 2009 bailouts was $498 billion. Of this, the Treasury Department was authorized to buy up to $250 billion in bank shares, which it later sold for a profit, from among Troubled Asset Relief Program (TARP) assistance totaling $245.1 billion. Government capital fusions into Fannie Mae and Freddie Mac totaled $191.5 billion.
This also explains why financial crisis fiscal policy was not inflationary whereas 2020 fiscal policy was, and is — all the money or most of it in 2008-09 stayed within the banks or large corporations, and almost none of it made it into the economy. By contrast, in 2020-21 by our calculations about half a trillion dollars was given directly to Americans. In the United States consumer spending accounts for roughly two-thirds of GDP. How have Americans spent that money? There’s no way of knowing for sure. Some socked it away in savings accounts, others used it to buy bitcoin and meme stocks, but a good portion spent it on goods and services, helping to drive the economic recovery as well as pushing inflation higher.
Inflation highest in 40 years
An article in The Atlantic makes some erroneous statements regarding the “transitory” nature of inflation (in fact it’s more sticky that many want to believe), but is correct in naming the main factors behind rising prices over the past year as: fiscal stimulus (including direct payments) tight labor markets and supply-chain problems resulting from the covid-19 pandemic.
Author Adam Ozimek writes, Because so much of the $1.9 trillion stimulus was distributed all at once, its immediate fiscal impact was a massive 7.6 percent of GDP in the first quarter of 2021…
In an economy where in-person services were still mostly shut down, sending big, onetime checks to people not only pushed demand above the supply, but also ensured that spending largely went into already capacity-constrained goods sectors, such as furniture, household improvements, and consumer durables. Manufacturers that were already stretched thin could and would expand only so much to match what they knew was short-term, pandemic-driven demand; predictably, this pushed inflation in the goods sector even higher.
The evidence of widespread and quickening US inflation is now overwhelming. Inflation in November spiked 6.8% compared to a year ago, the highest since June, 1982 and the ninth consecutive month the rate stayed above the Fed’s 2% target.
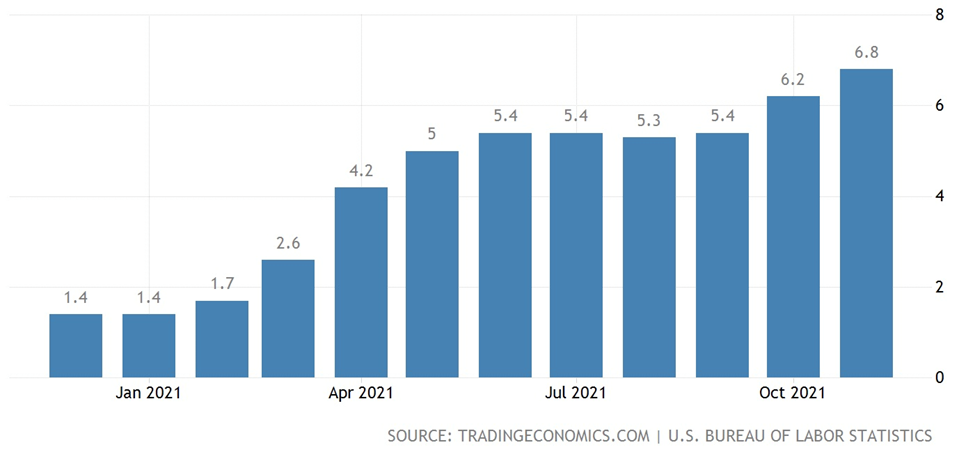
US inflation (CPI). Source: Trading Economics
The pace of the rise suggest the US Federal Reserve is well behind the curve in controlling price increases, led by “the essentials” of food, fuel and shelter.
The chart below by Trading Economics says it all, with the Consumer Price Index (CPI) in the United States climbing steeply to 278 points in November 2021 compared to just 262 points in January.
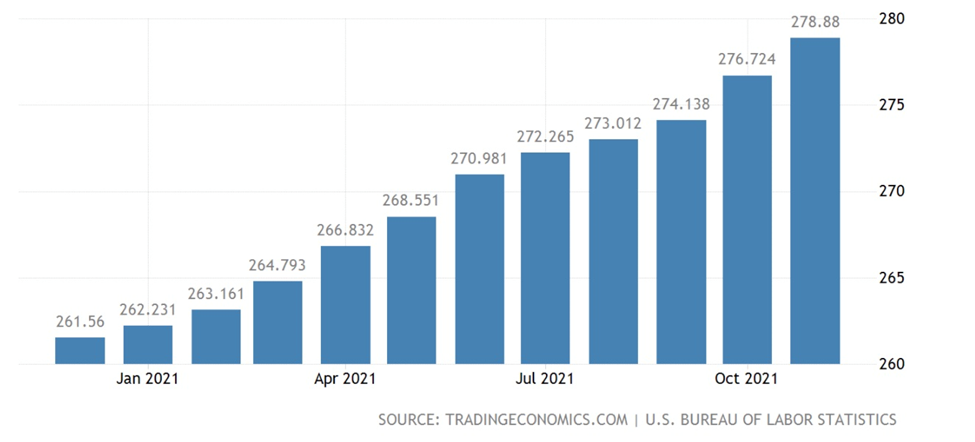
Consumer Price Index. Source: Trading Economics
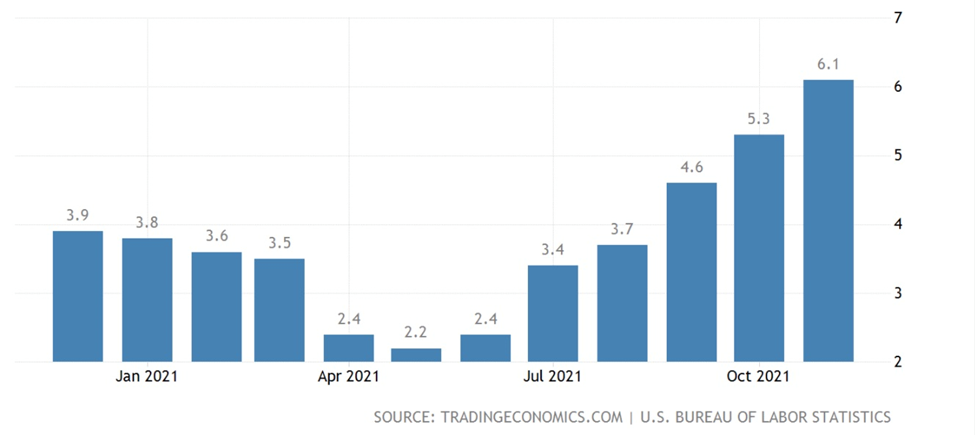
Energy costs recorded the biggest gain, 33%, including a 58% increase in gasoline and a 25% increase in natural gas; shelter costs rose 3.8%, the most since 2007; and food prices vaulted 6.1%, the highest since October, 2008 (the CPI for meat rose 16% year over year).
The producer price index in November climbed 9.6% from a year earlier, the largest in figures going back to 2010, and well above October’s 8.6%.
Food inflation. Source: Trading Economics
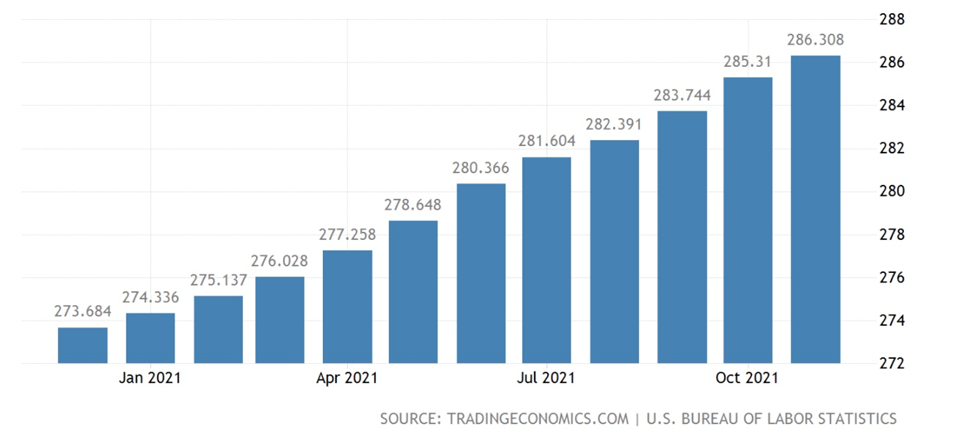
CPI housing utilities. Source: Trading Economics
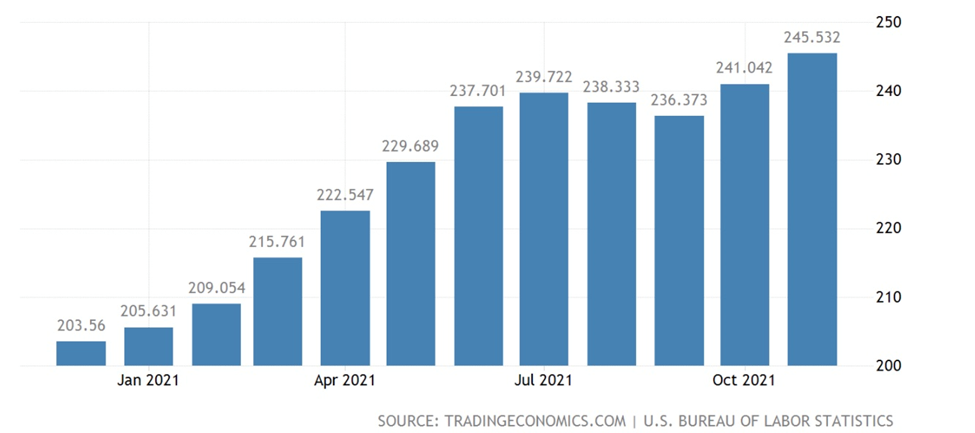
CPI transportation. Source: Trading Economics
Excluding food and energy, the inflation metric known as core CPI went up 4.9% compared to 4.6% in October, the highest since June, 1991.
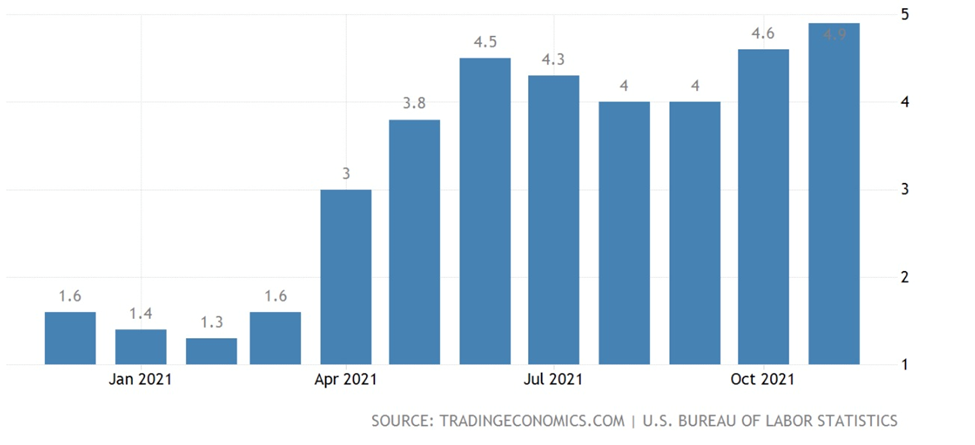
Core inflation rate. Source: Trading Economics
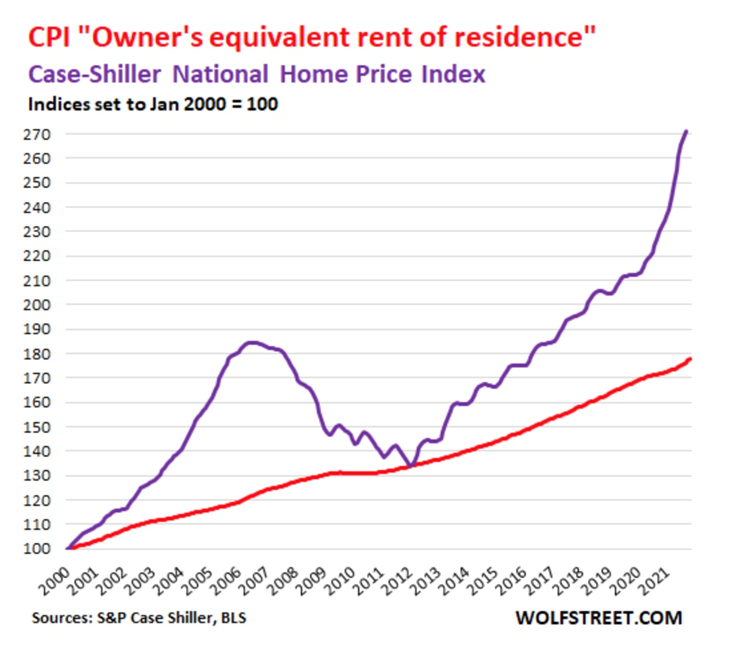
Wolf Street reports “actual home prices have spiked by historic amounts,” with the Case-Schiller Home Price Index which tracks price changes of the same house over time, soaring 20% year over year. The “owner’s equivalent of rent” which measures the costs of home ownership (red line in graph below) is also tracking higher.
Other salient points by Wolf Richter @ Wolf Street:
- Nearly all interest rates and yields, including on risky junk bonds, are now negative in real terms. This – the Powell Fed that unleashed this monster and has been feeding it month after month – has got to be the most reckless Fed ever.
- Inflation without food and energy – OK, Americans, go ahead and try to live without food and energy – spiked by 4.9%, the most since June 1991. This shows how embedded inflation is now in the economy beyond energy, and it has started to hit services, which is hard to explain away by jabbering uselessly about “bottlenecks and shortages.”
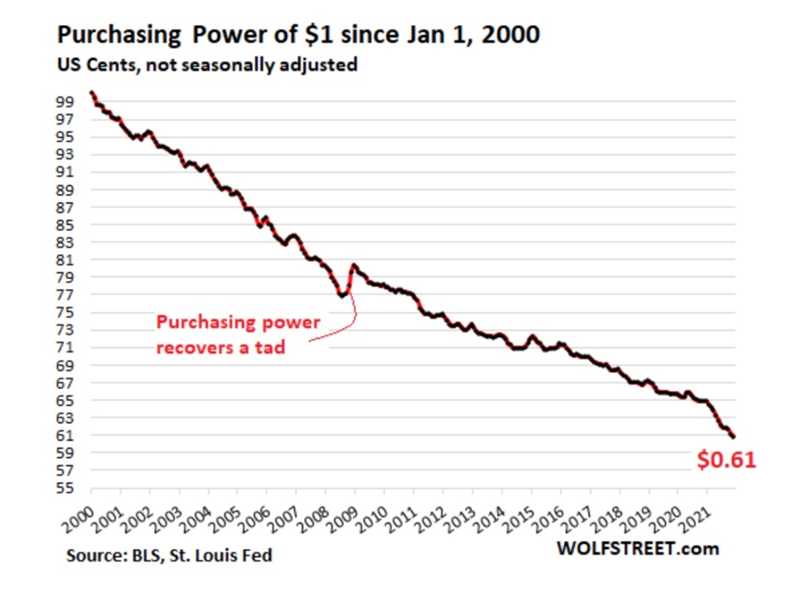
- Inflation in consumer prices is another term for the loss of the purchasing power of the consumer’s dollar. In November, the purchasing power of what was $1 in January 2000 dropped to 60.81 cents:
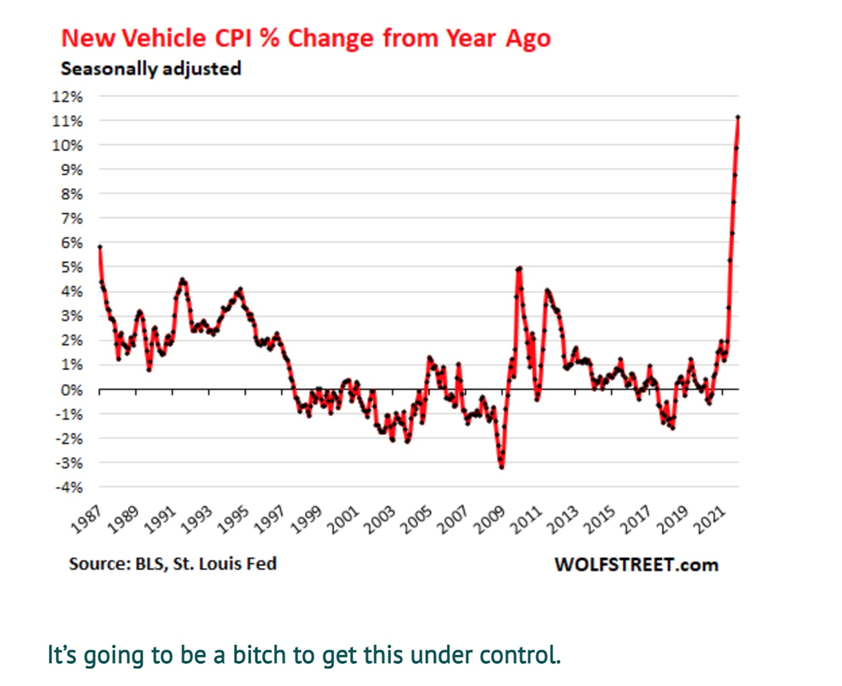
- The CPI for new cars and trucks spiked by 11.1% year-over-year. In the history of this CPI, there were only a couple of months in 1975 when new vehicle prices rose even faster topping out at 12.7% in March 1975. We may be looking at what in a few months from now will be the worst-ever inflation in new vehicles as consumers no longer care about price and pay whatever, even thousands of dollars over sticker (chart shows the year-over-year % change):
- This inflation is spiraling out of control because consumers and businesses are now willing to pay the higher prices. The dam has broken. The inflationary mindset has changed for the first time in decades. And this is happening as nearly unlimited amounts of newly created money washing around the globe has destroyed all sense of price resistance. And the Fed is still making it worse by pouring more fuel on the raging fire.
Trying to get this under control will be tough and will take a long time.
Higher costs have made their way to the bottom of the food supply chain ie fertilizer.
Higher fertilizer prices are usually passed onto the buyer of meat, fruits and vegetables, for the rancher/ grower to preserve his profit margin. This is precisely what we see happening right now.
In November the Green Markets North American Fertilizer Index hit a record high, rising 4.4% to US$1,094 per ton, surpassing the previous week’s record and its 2008 peak.
According to BNN Bloomberg, the fertilizer market has been smoked this year due to extreme weather, plant shutdowns and rising energy costs — in particular natural gas, the main feedstock for nitrogen fertilizer.
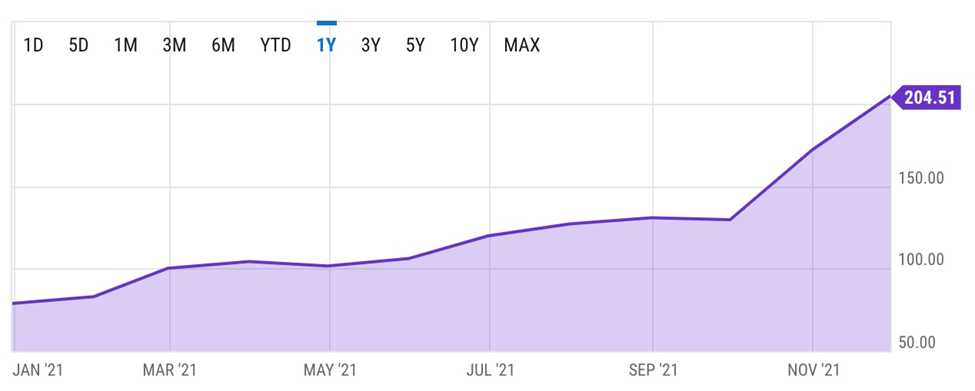
Fertilizers Price Index. Source: YCharts
In Europe, surging natural gas prices have forced a number of nitrogen-fertilizer plants to halt or curtail production.
Green Markets says expensive fertilizer could push US corn farmers’ cost of production costs 16% higher. It could also mean smaller corn crops as some farmers look at switching to soybeans. Corn futures in Chicago haven risen more than 10% since mid-October, driven by concerns over fewer plantings.
Higher fertilizer costs are affecting farmers at a particularly bad time, as their crops are being ravaged by droughts and pandemic-related shortages that have interrupted normally smooth supply chains that deliver food from farm to table.
Canadian grain farmers say the fertilizer rally “could not be any worse” after many saw their profits tumble this past growing season due to a severe drought that withered crops. With rising fertilizer prices adding an extra C$40-50 per acre, some may decide to plant crops requiring less of the stuff, like lentils.
Grain prices have surged over the past 12 months, with corn and soy coming within 5% of their 2012 drought-related highs. “The world is slowly slipping into an agricultural crisis,” reads a recent report by Wall Street natural resource investment firm Goehring & Rozencwajg.
Making the connection between high fertilizer prices and crops, G&R notes that China has already restricted production of both nitrogen and phosphate fertilizers to help conserve energy, and has announced export restrictions. The country is the world’s largest fertilizer exporter, producing half of global urea and nearly 60% of all phosphate-based fertilizer.
“In the near term, these restrictions will put huge upward pressure on fertilizer prices. Over the medium term, less available fertilizer will negatively impact crop yields leading to higher grain prices as well,” the report states.
Bloomberg quotes David MacLennan, CEO of Cargill Inc., stating that food prices will probably stay elevated next year:
“I thought inflation in ags and food was transitory. I feel less so now because of continued shortages in labor markets,” MacLennan said last month in an interview at the Bloomberg New Economy Forum in Singapore.
The news service summarizes:
The data underscore how a perfect storm of snarled supply chains, a rebounding economy, robust consumer demand and labor constraints has driven up prices across the economy. While first concentrated in a handful of categories associated with the economy’s reopening, inflation has since broadened out to other categories.
And then there is Shrinkflation. According to The National Post Shrinkflation is paying the same amount for a product, say a box of cereal, but getting less cereal inside. Manufactures do this to offset increasing input costs w/o increasing prices. A 2014 study published in the Journal of Retailing reported consumers are four times as sensitive to price differences as they are to changes in package size. Though consumers often express frustration when they notice downsized products these negative reactions are typically short-term. When manufacturers surprise people with higher price tags, however, they tend to lose market share: “There’s less of a risk to shrinkflation than to increase prices.”
And going higher
Looking ahead, the evidence of worsening inflation is mounting.
So-called breakeven rates, the amount of yield investors demand to offset expected inflation, rose late in the year to levels at or near record highs going back to the late 1990s, Bloomberg said. The 10-year breakeven rate, referring to what market participants expect inflation to be in the next 10 years, is charted below.
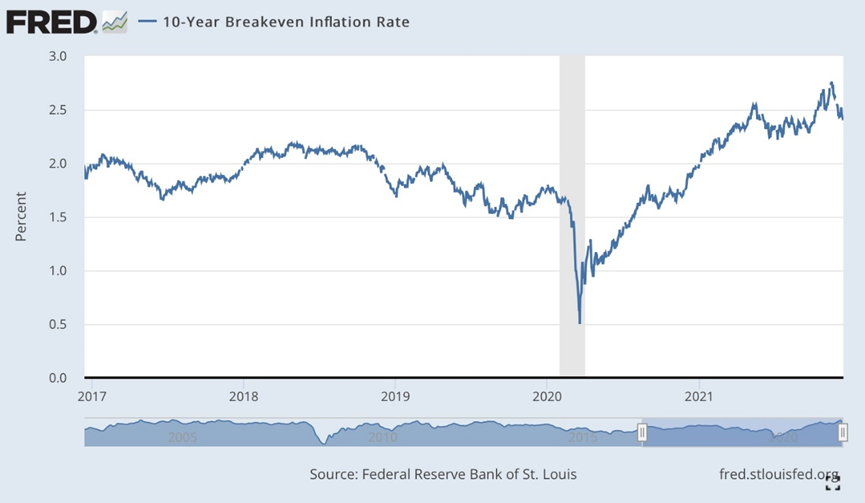
The New York Federal Reserve’s November survey of consumer inflation expectations hit a new all-time high of 6%, up from 5.6% in October, with at least a quarter of survey respondents seeing inflation surging to double digits.
**********
More from Silver Phoenix 500


