Quick Recap Of The Fed’s Foundering Follies And Our Descent Into Economic Madness


As September rolled into October, the US central bank’s monetary madness blew all over us like a fountain of foam in a windstorm. First, the Fed burst into $75 billion in overnight funding operations due to obvious shortages all over the map in bank reserves. Then the surge spread beyond that into longer-term temporary funding of $30 billion twice a week because the overnight loans were not up to the needs. That still not being enough to end the troubles, the Fed’s rapidly expanded the overnight operations to $100 billion and doubled the term operations to $60 billion. Those operations still did not end the troubles the Fed’s tightening had created, so the Fed decided to flood the murky money pools of this world with $60 billion in frothy treasury purchases. Although this money was permanent reinflation of the Fed’s balance sheet (unlike the temporary overnight and term repos), the Fed told us they are not QE (never mind that exactly like all previous QE, they give new fiat money with interest to primary treasury dealer banks that buy treasuries from the US government). The banks rushed in with more than four times the offers to resell treasuries they had purchased from the government to the Fed than what the Fed was willing to buy.
And, then, all of that pumping of of new fiat money into the monetary system was still not enough, so the overnight and term repos (essentially loans) had to continue. Then, because all of those operations together are still not enough, the Fed promised the repos will continue, “at least,” through January, 2020, and the creation of new money injected into the banks will continue, “at least,” into April.
But there is no problem here, and the Fed assures us none of this is QE, even though the aggregate of all of that is easily as big as any previous rounds of QE. By the end of the Fed’s already slated actions, it is estimated the Fed will have injected, at least, $850 billion dollars into the economy!
In all, a tremendous amount of churn out the flood gates in just one month as the Fed opened its unlimited reservoir to pour a river of money into the banks and economy to save the rich. It leapt back into doing that so quickly it couldn’t even wait until its regularly scheduled October meeting to make a studied decision. The immediacy says this was clearly an emergency, reactionary decision.
But that is not QE4ever!
Not according to the Fed.
You see, it cannot be called QE because a return to QE would be admission of catastrophic economic failure precipitating from of the Fed’s quantitative tightening regime, which I labeled “The Fed’s Great Recovery Rewind,” having seen where it would take us before any of the above madness and mayhem. It also cannot be called QE because, as pointed out in my latest QE4ever article, that would be illegal since QE forever is the same thing as monetizing the national debt, expressly forbade by congress.
How it all came down
The fix is in, and exactly in the manner I have stated for years it would happen. (I’m not suggesting I’m the only one to see how this would play out, as others also saw by similarly conceived routes the USS Fed was headed for the rocks long ago.) Here is the course I laid out by which the ship would hit the rocks:
-
When the Fed finally stopped interest cuts and stopped QE, the Fed would believe it had actually created a durable recovery. That apparent success would lead it to reverse all of that, as it had long promised it would, in order to prevent economic overheating and runaway inflation.
-
Thus, the Fed would start down a “post-recovery” path of raising interest targets and attempting to suck money back out of the monetary system (QT) because, for peculiar reasons unreconcilable to the intelligent mind, the Fed never understood that doing the opposite of everything it had done to “create a wealth effect” would bring about equal and opposite destruction of that superficial wealth — common sense not being a modern economist’s forte.
-
The Fed would, nevertheless, have opportunity to find out very quickly that it was sucking the life out of its recovery because the stock market would crash as soon as the Fed’s balance-sheet reduction built up speed. I laid out that it would crash over a period of years in long-separated legs that timed out with the Fed’s increases in the rate at which it reduced its balance sheet. Once the Fed specified its unwinding schedule, I said the first leg of that crash would hit in January 2018, the next in the summer and the worst for 2018 in the fall, likely starting as an October surprise.
-
The Fed actually cannot unwind at all, having created an utterly dependent economy, so any point at which it would stop its interest increases and the QT would be too late; but the longer it went, the worse the wreckage of its fake recovery. Because the Fed believed it could tighten, I said it would tighten to a disastrous level before it figured out from the market and economic troubles building around it, how much damage its tightening was causing.
-
By the time it returned to loosening with new interest-rate cuts and more QE to recover from the damage it inflicted on its own fake recovery, the economy would already be sinking into recession. That, I eventually said (a separate issue from the stock market), would become apparent in the summer of 2019.
-
Because there is a lag time for the general economy’s response to Fed policy changes of, at least, six months, the economy would continue to recede for, at least, six months beyond the Fed’s resumption of QE as the previous tightening continued to take hold while the new loosening had little effect. (That would be six months beyond now.)
-
As a result, the Fed would find itself behind the wave because its response would not only be too late but it would be too small because the Law of Diminishing Returns has already shown us that greater and greater amounts of QE are needed to have a similar effect; and the Fed has a six month lag to see before it gets to see the response was not enough.
In other words, we’ll be far down the road of economic collapse before the Fed gets that all figured out. By then, the Fed will be leaping in with the solution it should have deployed immediately when its recovery started to fail (if it wanted to temporarily prop the economy up again via its familiar means). Right now we are at step #5.
Never was there any chance the Fed’s recovery plan would lead to anything lasting.
The latest signs of continued descent into recession
Here is the situation as the Fed now starts the non-QE of step #5, which is actually going to become QE4ever because the Fed has no exit plan, and all economic matters are still turning worse:
Repo operations have continued unabated:
Retail sales and industry decline:
September’s retail sales fell 0.3% month on month. That was not just brick-and-mortar. Online sales, as a part of that, also declined 0.1%. Business inventories have been slowly but steadily building since 2017, which gradually suppresses wholesale purchases from manufacturers then backs up to production decreases. Not too surprisingly, then, industrial production fell 0.4% month on month in September, double the amount that was anticipated by economists.
CEO confidence falls precipitously:
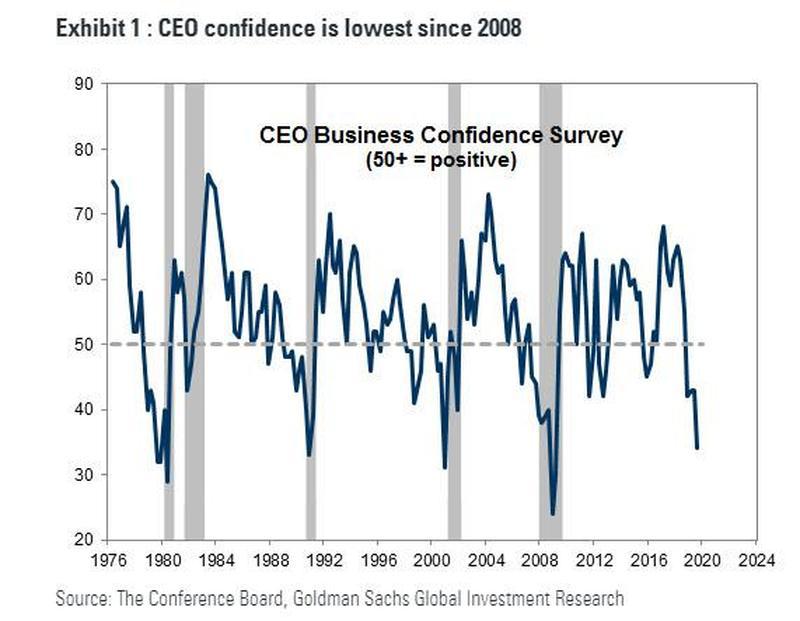
Who knows better than CEOs whether they have anything to be confident about? Sure, market traders claimed last week that corporations were doing well on earnings because traders have their books to sell. It’s a simple and deceptive as that. They could only claim earnings were fine, however, because, as has happened every quarter this year, earnings expectations were lowered even more than they had been lowered in previous quarters.
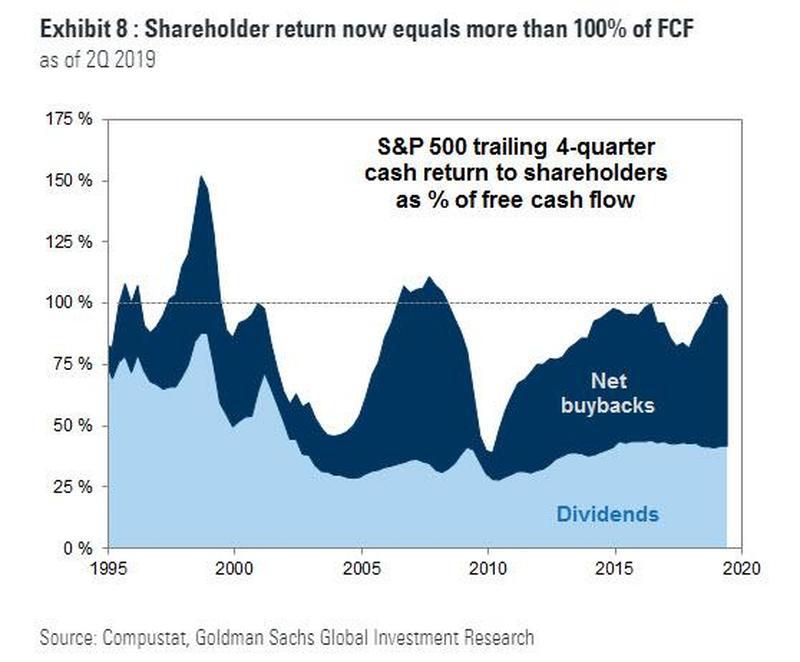
That leaves one to wonder if buybacks have soared to record levels again because CEOs and corporate board members are using corporate cash to buy themselves out as quickly as possible:
The housing decline declines again:
I had last noted in a previous article that housing was the only economic indicator that had moved out of sync with my recession predictions. The rest were aligning in lockstep. Well, August’s upward spike turned out the next week to be a mere blip as the downward path has resumed:
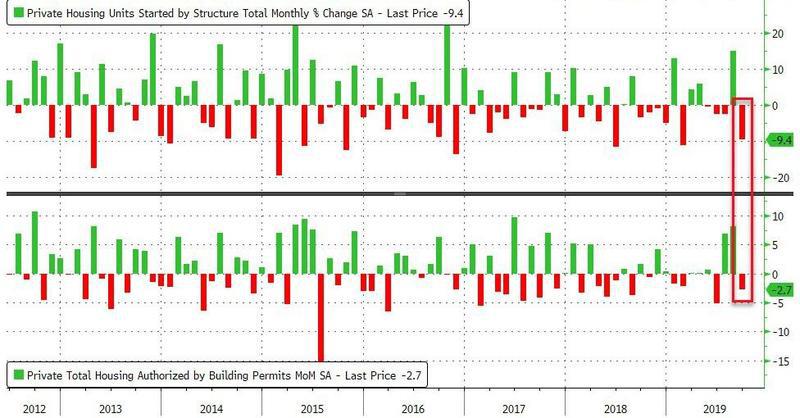
Housing starts fell 9.4% in September month on month, but that was still 1.6% above September, 2018. Housing completions, however, fell 9.7% in September, month on month, and were dropped 1% below September, 2018.
Those are just the indicators that have shifted since my earlier October article, “The Relentless Road to Recession.”
GDP pushing recession under heavy trade suppression
Notice how close we came to recession in the fourth quarter of last year, as reported in January of 2019, and notice how rapidly the fourth quarter plunged from the third:
source: tradingeconomics.com
The same rapid plunge could happen in the third quarter of this year, which will be reported October 29, and we still have one quarter to go in the year with not a lot of reasons in all the stats I’ve been showing throughout the third quarter to believe things have any chance of heading up.
Even the partial trade deal that is presently in the works — which won’t be signed until, at earliest and if at all, the middle of November — only locks in place the tariffs that already exist. It is nothing more than an agreement to stop escalating tariffs. Again, it is not an agreement to back the trade war down, but merely to stop escalation that is already scheduled for December. Therefore, it won’t bring any relief to the above picture of declining GDP, except in pork and soybean sales.
In fact, the International Monetary Fund estimated its effect this way, saying it …
could reduce the harm done by tit-for-tat tariffs imposed by both countries over the past 15 months. Instead of dragging global growth down by 0.8%, the impact might be limited to 0.6%, Managing Director Kristalina Georgieva said on Thursday.
In other words, without the deal, global GDP growth is expected to fall another 0.8%. With it, damage will by slightly mitigated to where global growth will only fall another 0.6% due to trade wars. The US is impacted more directly by the trade war with China than the rest of the world, so larger declines in either case should be expected. That means you can knock, at minimum, another 0.6% off the above US GDP growth chart in the months ahead just from the continuing US trade wars, and that is the best-case scenario if this agreement gets signed in November.
I think this no-deal trade deal has a better chance of being signed than any past promises; but it is still a deal without hope. Trump may be feeling some desperation to mitigate economic damages as we go into the election year, and Krazy Kudlow is telling him he needs to sign:
President Trump’s top economic adviser last week arranged an Oval Office briefing with outside experts who warned the president that continued escalation of U.S.-China trade tensions could imperil the economy and hurt Mr. Trump’s chances for re-election, according to people familiar with the meeting.
But it’s still a nothing deal that merely keeps trade from worsening. Meanwhile, new tariffs just went into place last week between Europe and the US, and trade with China will continue to worsen from tariffs already in place that are still working their way down the long Silk Road to the consumer.
With recession advancing relentlessly now from every quarter and the central bank’s recovery broken on the rocks and floating away like flotsam in the ebbing tide, I continue looking deeper into the ongoing words of all central bankers regarding their joint efforts to create a vast, global solution to a now fully global and growing problem in my next Patron Post. It’s not too late to sign up to get access to this ongoing saga of the central banksters’ big plans in their own words, which has been my theme throughout 2019.
*********

David Haggith started writing about the economy after he predicted The Great Recession half a year before it hit and was puzzled as to why no economists or stocks analysts saw it coming. In the months after the crisis broke out, he started to write humorous editorials in a series titled “Downtime,“ which chided the U.S. government and bankers who should have seen the economic collapse coming but whose cronyism, greed and ineptitude caused them to run the world into a ditch. Those articles were published in The Hudson Valley Business Journal, The Valley City Times-Record (North Dakota), and The Daily Herald in Tennessee. Haggith is dedicated to regularly criticizing the daily news — not just the content but the uncritical, unthinking nature of almost all of the reporting. He now writes his own blog, The Great Recession Blog, to break down the news as an equal-opportunity critic toward both Republicans and Democrats / Conservatives and Liberals … since neither kind of politician has done anything worthwhile to plot a better economic course. His articles are regularly carried by several economic websites.
More from Silver Phoenix 500


