Seeking Confirmations…US Stock Market


We have several inputs forecasting change (market pivots) ranging from seasonal tendencies to an expected US dollar rally, Fed monetary tightening (such as it is), the 30 month S&P 500 cycle, not to mention a presidential administration in utter disarray and not having done much, if anything, to further the fiscal stimulation (which, the story goes, would replace the Fed’s monetary stimulation under the previous administration) view that much of the stock market’s post-election euphoria was built upon.
In other words, we have working plans for two main themes; a correction in the stock market and in the mirror, a tradable rally in the gold sector. Based on an email exchange with a subscriber, I want to be clear that yes, I think the stock market has probably topped out for something more than a routine pullback; but no, we do not have the all-clear on that from a technical confirmation standpoint just yet, although the sector breakdowns noted in a Friday update held that status to close the week.
As for the precious metals, gold shot above and closed below our 1st target of 1300 on Friday and HUI broke above, and closed below short-term resistance. Despite that little head fake the sector is constructive insofar as the stock market seemed to change character and did not put on an op/ex Friday relief (short covering) rally, implying a waning of confidence. But the gold sector has not technically confirmed.
US Stock Market
This chart shows what I mean about “seeking confirmations”. Who’s broken down? The Dow? It is above the SMA 50. Semis? What if just maybe that is a Symmetrical Triangle targeting much higher levels? Small Caps? Bear biased but no breakdown.
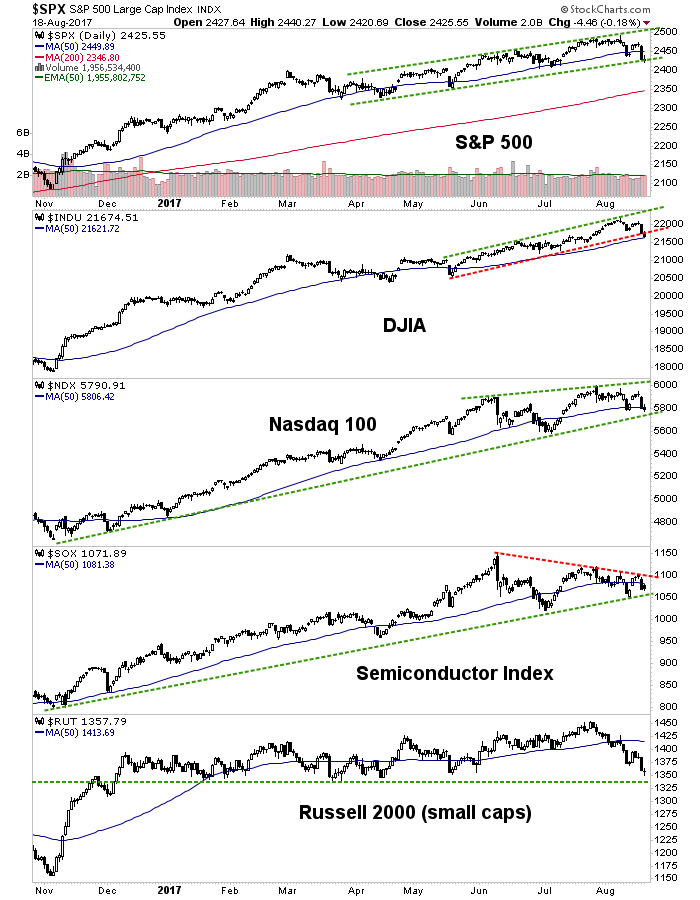
In TA it is absolutely important to have facts to go with opinions. My opinion is that a correction is beginning, not ending. But the facts are that not one of the items above is broken down in standard technical terms. Although in a Friday update we did note XLV to be in a breakdown posture with a target of 75. This chart would expand that to 74 (SMA 200) to 76 (trend line).
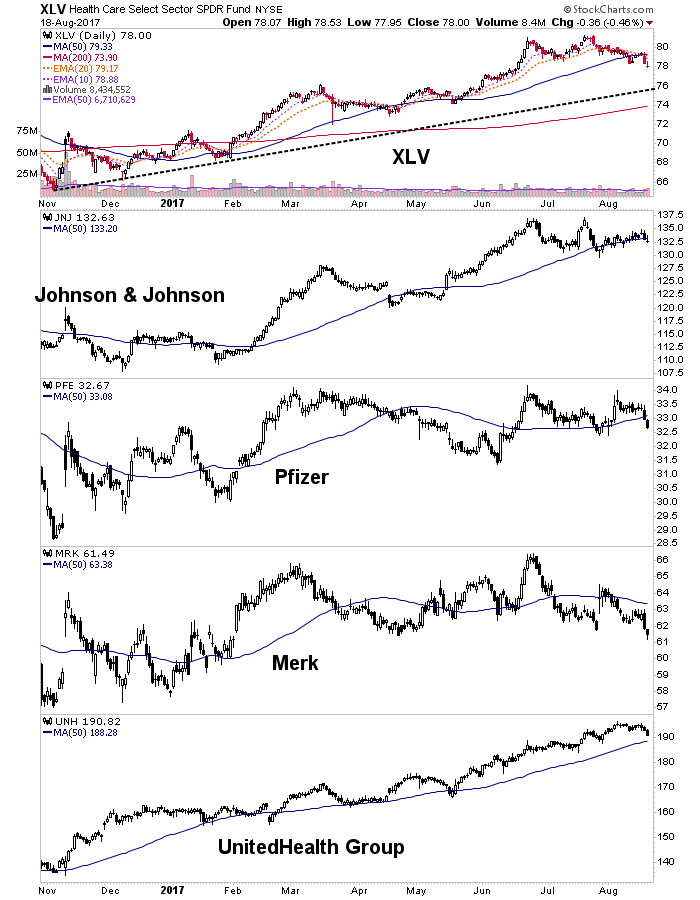
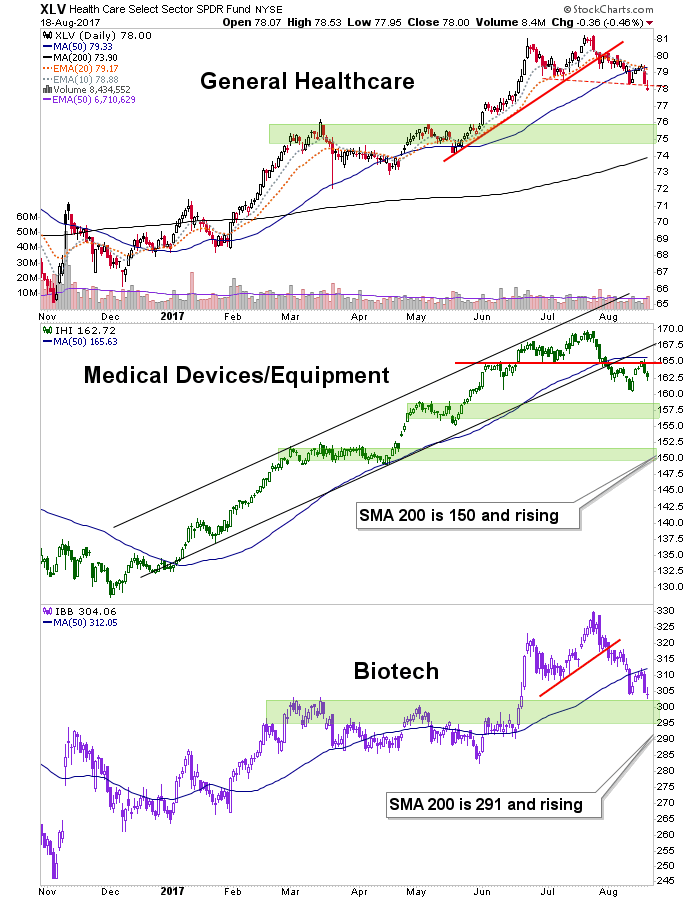
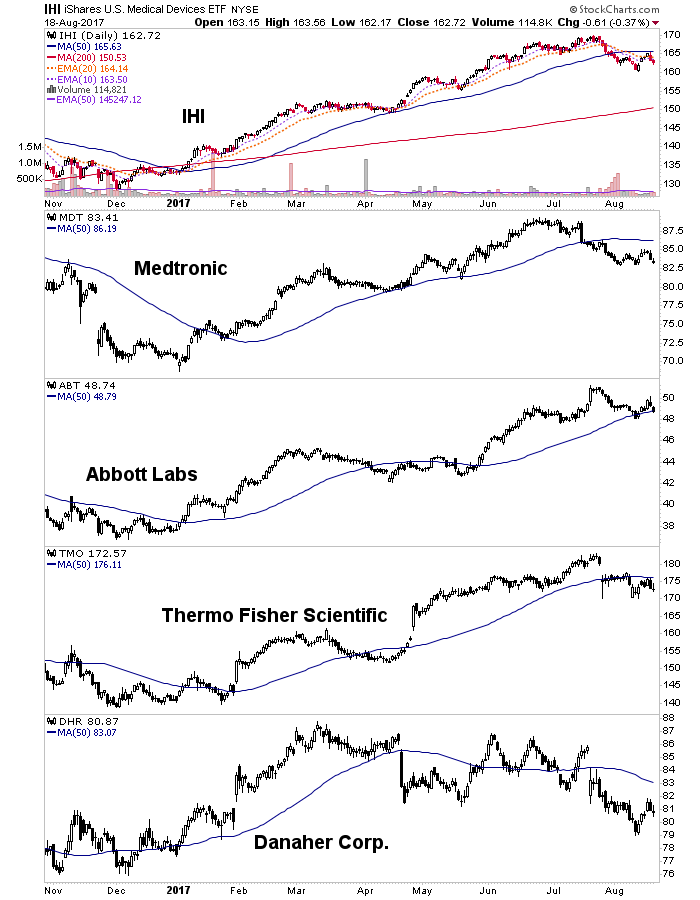
Looking closer at Healthcare, we see strong lateral support for XLV at 75 +/-, a reasonable target for Devices (which I’ve taken the liberty to short since we’d taken the liberty of being quite bullish the sector a year ago) is around 150 (assuming a market pullback) and we can still anticipate 290 to 295 on the Biotech ETF.
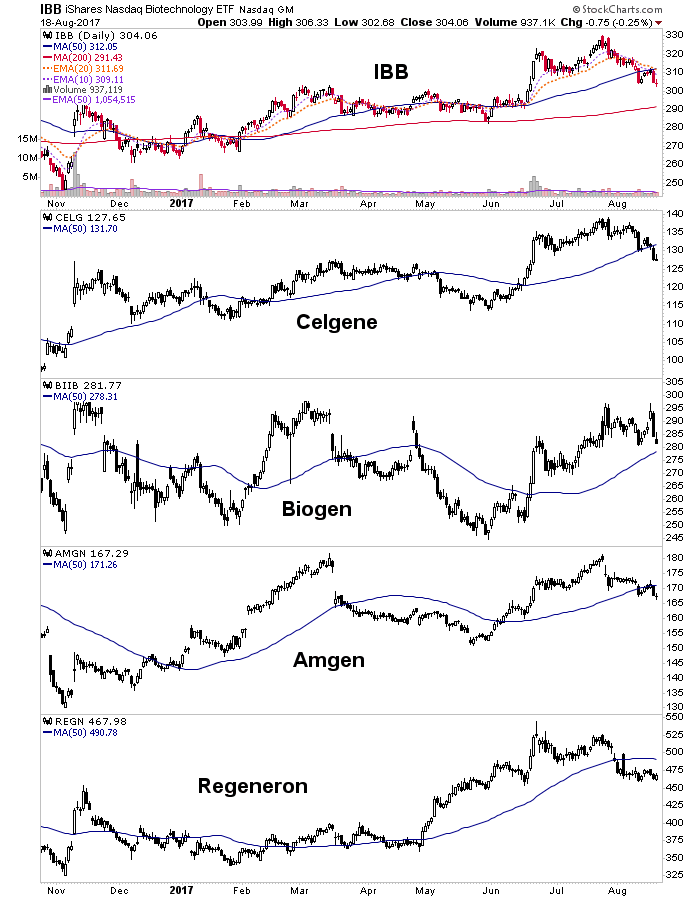
Here is said Biotech ETF and some of its top components looking for lower levels (with Biogen in a relative still-bullish state).
The Device sector has been following MDT into breakdown mode. TMO in particular, looks like it is setting up for significantly lower levels. I shorted the ETF rather than individual companies to back out individual company risk. I tend not to be that sort of gung ho player from the short side. But boy, that TMO looks toppy.www.silver-phoenix500.com/sites/default/files/gt082117-5.png
NFTRH 461 then covered the balance of the US stock market (Financials, Industrials, Technology, Materials, Energy, Transports, Utilities and Consumer Staples & Discretionary before moving on to Market Internals, a detailed look at 18 different global markets, commodities, precious metals, currencies, bonds, sentiment and well, the whole shootin’ match.
NFTRH.com and Biiwii.com


