Silver Antidote To Bubble Craziness


CHARACTERISTICS OF BUBBLE CRAZINESS
-
U.S. stocks, according to many measures, are the most over-valued in history. We live in a Bubble Zone!
-
Bitcoin and other cryptos are definitely in a bubble, but they could rise even higher.
-
Bonds yield little, and in many European countries, less than zero. Central banks have created this distortion to the detriment of savers, insurance companies and pension funds.
-
Real estate: Some locations, such as New Zealand, Canada and Australia are up a factor of 8 to 20 since 1980. Houses have become unaffordable for many, even with historically low interest rates.
-
Silver and gold: No bubble since 1980. Prices have been repressed since 2011 and are attractive now.
INVESTING IN BUBBLE CRAZINESS:
-
Institutions buy stocks because bonds yield so little. This works until the inevitable crash. Think tech stocks in 2000 or 2018(?).
-
Institutions and central banks buy bonds trusting the “greater fool” theory. Argentina sold 100 year bonds. What happens when the world runs out of “greater fools?”
-
People buy Bitcoin because it is going up, and it might double again from here. Are you comfortable investing savings with that plan?
-
Others deposit their digital currency units into a “high yield” checking account that yields 0.01% interest. Or they “invest” in a CD that guarantees a yield of 1% per year in a currency that will be devalued by far more. Others buy a motor coach that depreciates $100,000 when they drive it from the dealer lot. Or they purchase a house that costs $10,000 to $50,000 per year in taxes, insurance, maintenance and utilities before principal and interest.
-
Demand value! Not doing any of the above! Avoid fads, bubbles, central bank distortions and obvious financial insanity.
WHAT’S LEFT? GLAD YOU ASKED!
-
What has been money for thousands of years?
-
What is more permanent than ephemeral digital currency units that are continually devalued?
-
Asia has aggressively accumulated it for decades.
-
What has been secretly sold from western vaults and shipped to Asia?
-
What is used in thousands of industrial and medical applications?
-
What has been suppressed by governments and central banks because they promote their own digital and paper currencies which have zero intrinsic value?
THE WINNERS ARE SILVER AND GOLD!
-
But “they” claim gold and silver are volatile and dangerous. Gold and silver might go up or down (for a few years) when measured in digital currency units created from “thin air” by corrupt central banks. Gold in 1971 was $42 and is about $1,300 today. Silver prices have increased similarly as central banks devalued the dollar.
-
For other examples of volatile and dangerous prices, consider the price chart for Global Crossing stock or Enron stock. Or the NASDAQ 100 from 2000 to 2002 (down 84%). Or the S&P 500 Index from 2007 to 2009.
-
But “they” claim gold and silver are relics of a bygone era, and digital is the wave of the future. So why are Russia and China accumulating gold bullion? What happened to Iraqi gold, Libyan gold, and Ukrainian gold, and who wanted it?
-
Do dictators escape while carrying paper currency units or gold bullion?
-
Would you prefer 100 ounces of gold or 130,000 paper dollars in a ten year time capsule?
-
Central banks create trillions of U.S. dollars, euros, pounds, yen and Swiss Francs each year. The Swiss central bank “creates” currency units and buys U.S. stocks. The media thinks “creating from nothing” is normal and healthy, yet informs us that investing in gold, to protect from devaluing currencies, is silly and dangerous!
GOLD AND SILVER IN THE BIG PICTURE:
U.S. dollars are created as debt. Central banks and governments want more currency units so debt, deficits and expenses exponentially increase.
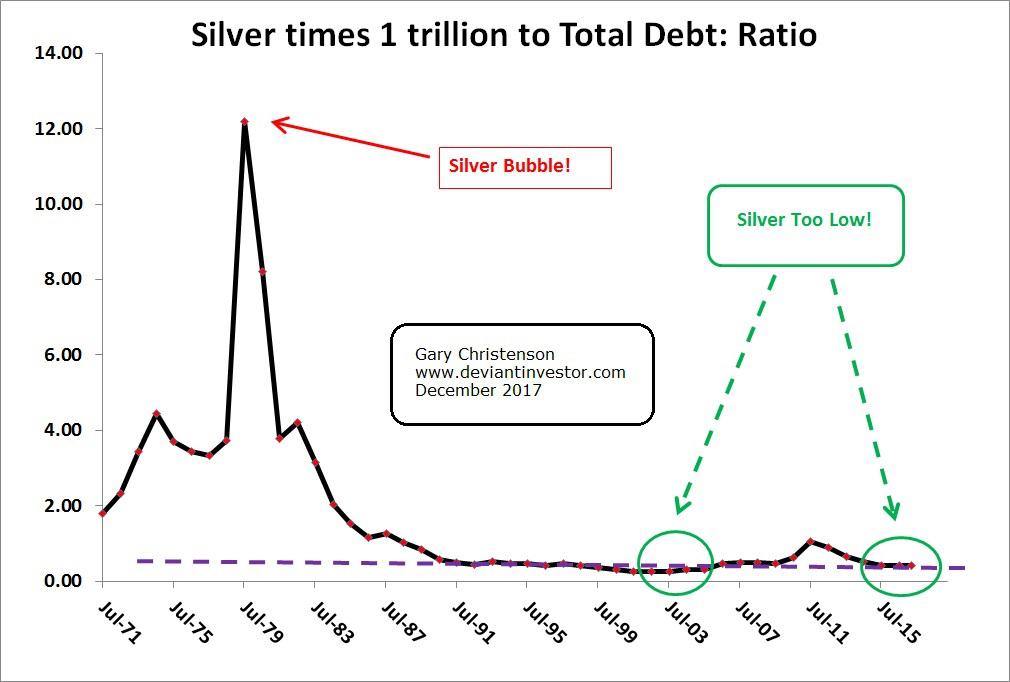
Graph the price of silver (times a trillion) divided by the national debt. The ratio is low because debt has increased rapidly and silver is inexpensive.
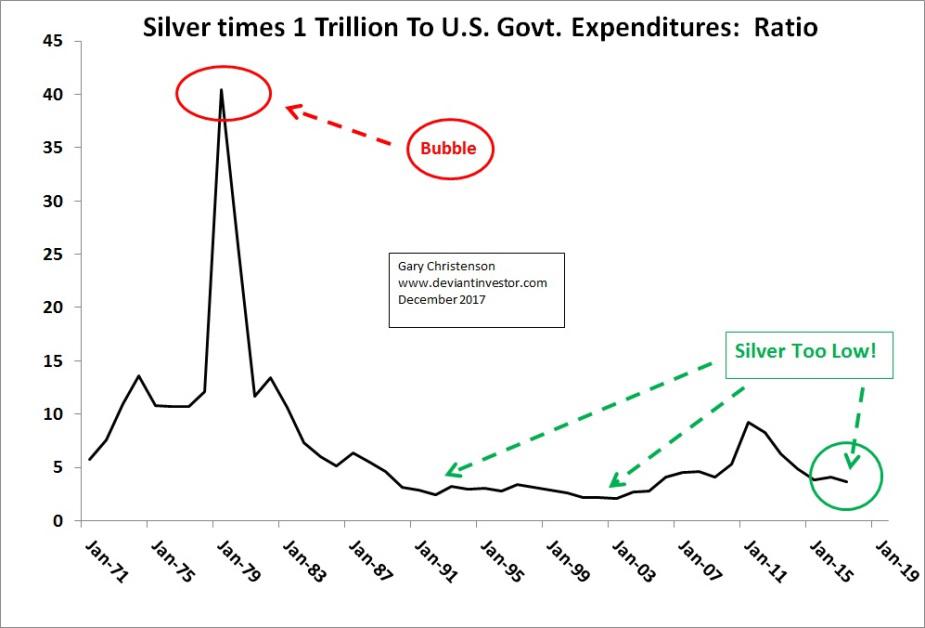
Graph the price of silver (times a trillion) divided by U.S. government annual expenses. The ratio is low and silver is inexpensive compared to total U.S. government expenses.
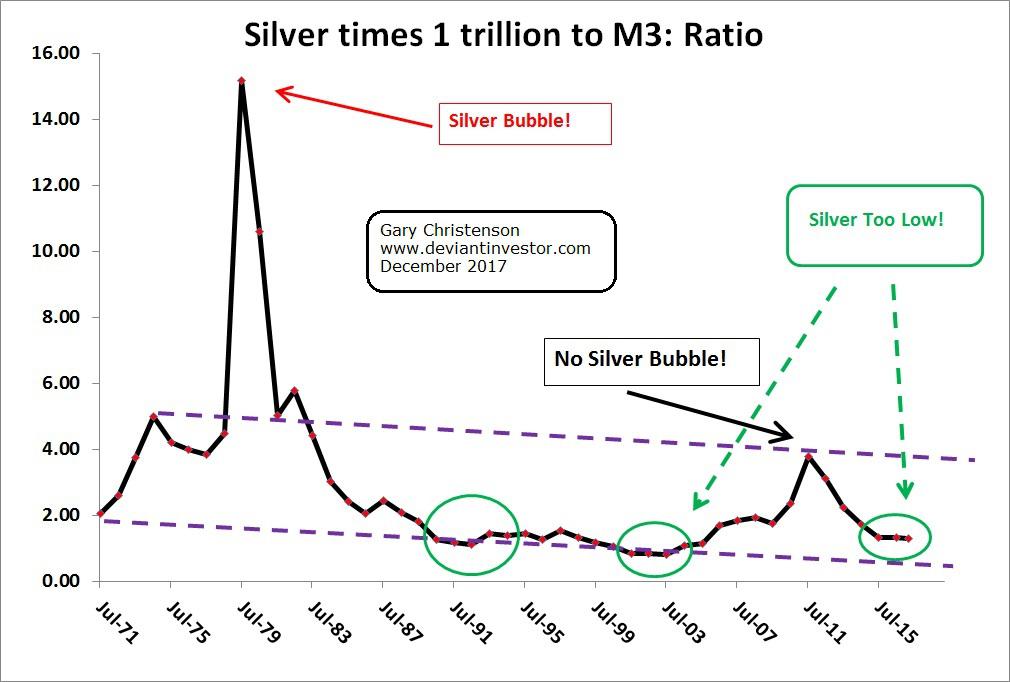
Graph the price of silver (times one trillion) divided by currency in circulation as measured by M3 (St. Louis Fed).
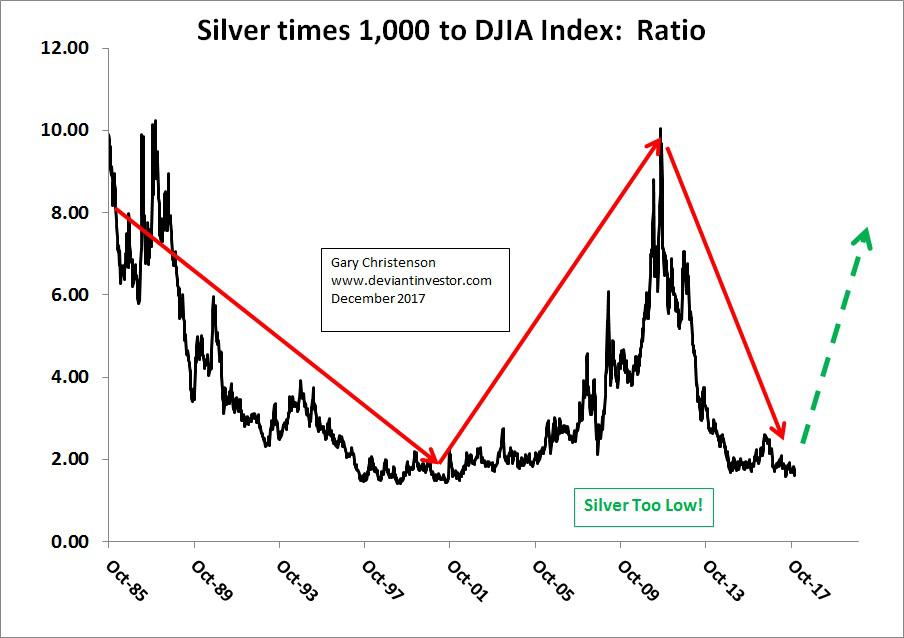
Graph the ratio of silver to the Dow Jones Industrial Average over 30+ years. The ratio is low, as it was in 2001 when silver sold for under $5.00. In early 2018 the DOW is too high and silver is inexpensive. Both will reverse.
SHOULD WE BUY SILVER OR GOLD?
Graph the ratio of silver to gold. Since 1971 a high ratio has indicated the top of a bull market in both silver and gold. But when the ratio is low (silver is inexpensive compared to gold) both silver and gold are cheap, especially compared to other paper and digital assets – like now!
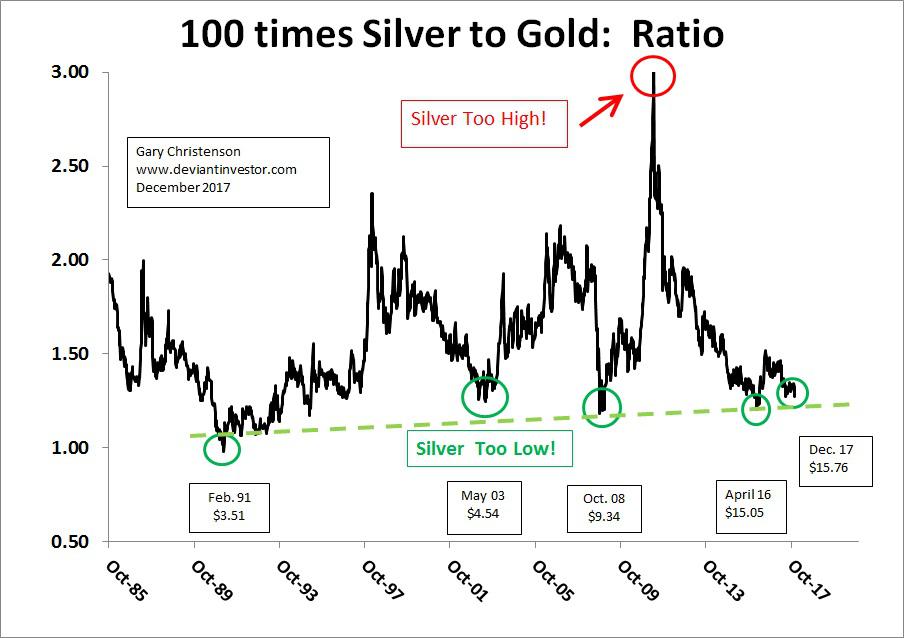
The lows in the ratio show excellent times to purchase both silver and gold, particularly silver. Silver prices are listed in the boxes at the ratio lows. Expect the ratio to increase as both metals rise in price during the metals bull market that restarted in December 2015.
CONCLUSIONS
-
Bonds, most stocks, and Bitcoins are too expensive and have risen too far and too fast.
-
Some, perhaps most, real estate is overpriced and ready to fall.
-
Silver in early 2018 is inexpensive compared to M3, National Debt, government expenditures, the Dow and gold.
Gary Christenson
 Gary Christenson is the owner and writer for the popular and contrarian investment site Deviant Investor and the author of the book, “Gold Value and Gold Prices 1971 – 2021.” He is a retired accountant and business manager with 30 years of experience studying markets, investing, and trading. He writes about investing, gold, silver, the economy and central banking.
More from Silver Phoenix 500


