Silver To Gold Ratio Shows That Silver Is The Place To Be


Here is the silver to gold ratio, or the number of ounces of silver one ounce of gold can purchase. At the close of Friday’s trading an ounce of gold was worth 61.55 ounces of silver; that is a lot of silver, but not as much silver as an ounce of gold could purchase from 1987-1998 during the glory days of Alan Greenspan’s stock market bubble.
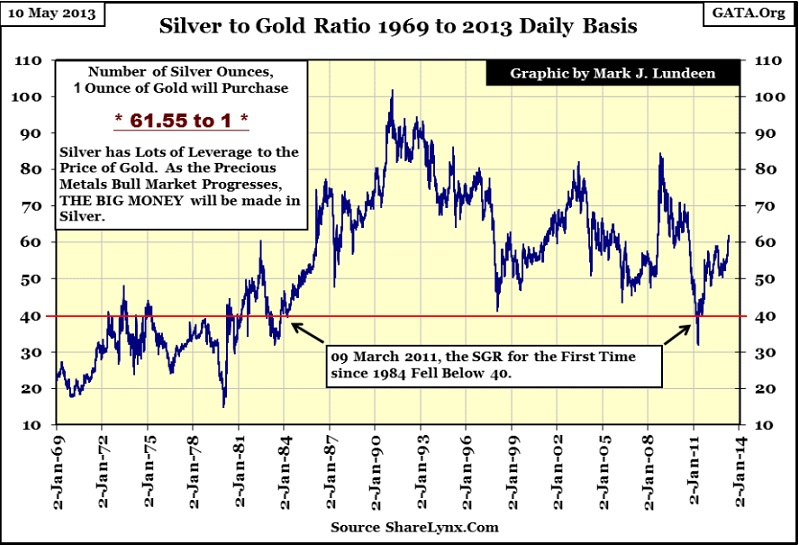
For your information, rising markets for both gold and silver can in the main be identified by seeing the SGR decline. When the prices of gold and silver are falling, typically the SGR increases. This makes silver a leveraged play on gold during both bull and bear markets. As we are now in a precious metals bull market, and with the ratio now over 60, silver is an especially attractive investment! But markets being what they are today: regulated, the ratio may increase from here, but I doubt we will ever see a SGR of 70 ever again.
The thing I find interesting in the SGR’s chart is the difference in the SGR during the credit crisis of 2008 and the current rise since late April 2011. From March 2008 to January 2009 the SRG shot up from around 50 to over 80 ounce of silver to one ounce of gold. Nowhere else in this chart can we see such a large increase in the SGR in such a short time. Well, Wall Street and Washington whacked the old monetary metals markets during their mortgage crisis, especially silver, which declined 57% from March to October 2008. Five years ago, gold fell only 29% during the credit crisis.
The thing I notice currently in the SGR; even though it has increased by 30 ounces of silver since late April 2011 (two years ago), the latest selling panic of 12 & 15 April only resulted in an increase of three ounces of silver in the ratio. What happened three weeks ago is almost a non-event on the ratio’s plot line, and that seems a bit odd to me. The majority of the current increase in the ratio (from 50 to 58) occurred from last September to April 5th. For all the horrible market sentiment currently circulating in the gold and silver market, I would have thought the latest drive-by shooting from Wall Street would have had more impact on the silver gold ratio than just three ounces. It seems the current action in the silver gold ratio is confirming the many news stories of rising global retail demand for gold and silver since mid-April.
What I’m watching for now is for the SRG to reverse in the months to come, and then test its lows of late April 2011 when it declined to 33 ounces of silver for one ounce of gold. If this happens this year, and it may, investors in silver will have twice as merry a Christmas for 2013 as will investors in gold.
But all that depends on the assumption that gold and silver are in a bull market. Currently, there are lots of experts who now claim that the precious metals bull market is now over. That “experts” are saying this is true. But what is also true is that most of these same “experts” have been warning the public about gold since 2001 when an ounce of gold could be purchased for only $255 an ounce. Little noticed in the financial media is that Gold has risen over 600% since then.
Okay, so gold is up big since 2001. However gold was up over 600% in August 2011. But today it is up only 500% from 2001, and to lots of people that means that gold is going the wrong way - down. Well, I don’t care what lots of people think; lots of people think the stock market is now in a bull market as the Dow Jones has increased 29% above its 2000 high, and 7% above its 2007 high. Gold and silver have vastly outperformed stocks and bonds in the past twelve years for the darn good reason that global central banks are determined to save the global financial system by destroying the currencies they issue.
All Americans need to know if they should exit stocks and bonds and buy gold and silver can be seen in the chart below. Sometime in the not too distant future, the US dollar’s ability to function as an economic asset will fail because of Doctor Bernanke’s unending program of quantitative easing seen below. In the many thousands of years of monetary history, governments have regularly destroyed their money one way or another. However holders of gold and silver have survived and prospered in the aftermath.
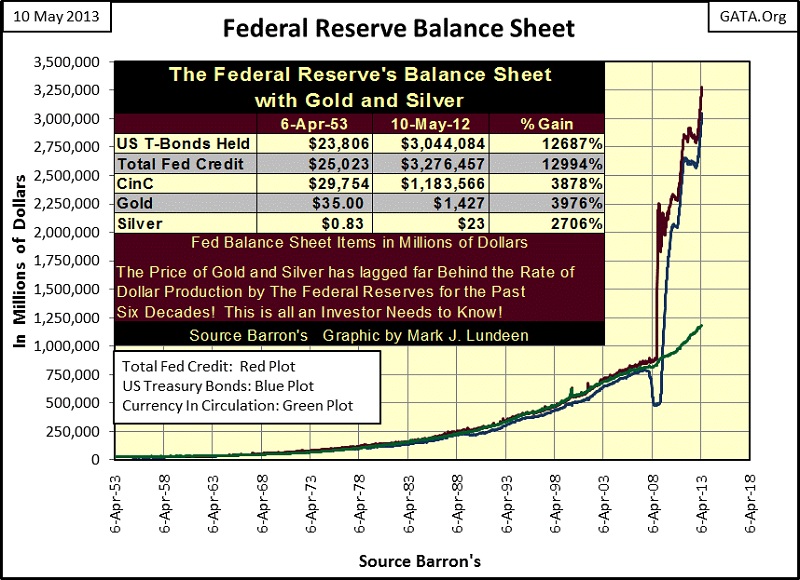
Still, holders of the old monetary metals may not prosper as they believe they should in the coming economic reality made manifest by the greed and ignorance of the current “best and the brightest” who now control our world. But like the boom times, economic busts don’t last forever either. So, I figure that it may not be until the upswing off the bottom of the coming bear market before investors in gold and silver will see the full benefit of purchasing gold and silver today. After all, what good is money, real or digital dollars from the Federal Reserve if all the stores in town are closed for business? I’m not saying it will get that bad, but it could for a while if you believe what Lord Keynes said about monetary inflation:
"There is no subtler, no surer means of overturning the existing basis of society than to debauch the currency. The process engages all the hidden forces of economic law on the side of destruction, and does it in a manner which not one man in a million is able to diagnose."
- Lord John Maynard Keynes
And the above chart of the Federal Reserve’s balance sheet is exactly what Lord Keynes was warning about!
The plots for gold’s Bear’s Eye View (BEV) and step sum in the next chart look interesting. What is a BEV plot and step sum? The Bear’s Eye View is exactly what it says it is; the market as Mr Bear sees it on the blue plot (left scale) below. Mr Bear sees the market in percentage terms, specifically the 100% that is all that separates each all-time high from a total wipe out in an asset’s valuation. Investors in Lehman Brother shares discovered this in 2008. Lehman may have been up several thousand percentage points since the beginning of 1980’s bull market, but it took a loss of only 100% for Mr Bear to convert billions dollars into something much less than a penny on Lehman’s shares.
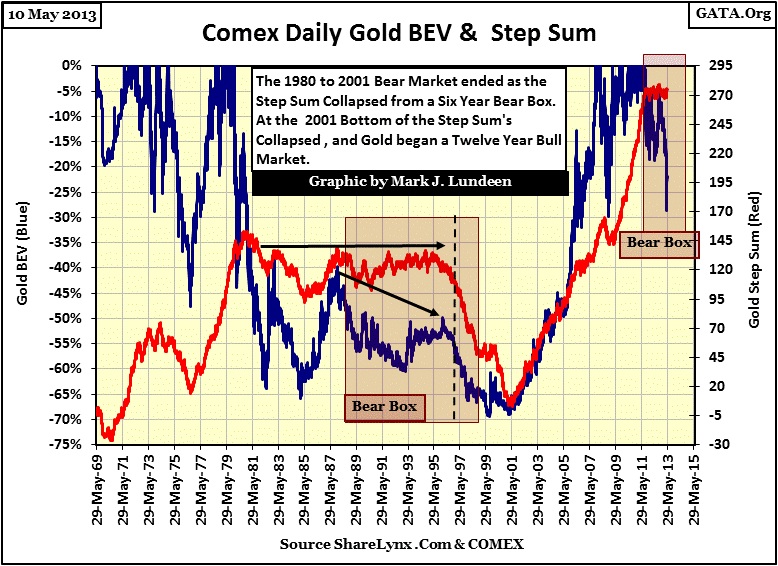
This means that Mr Bear doesn’t care an iota about gold’s gains, as each new all-time high for gold since 1969 in the BEV plot above is converted into a big fat zero, as that is what Mr Bear thinks of each bull market’s new all-time high - ZERO. All Mr Bear cares about is how much of a percentage he can claw-back from the bulls’ gains. So, with a BEV plot we are observing correction-declines within bull markets (periods when there are lots of BEV Zeros), and bear market declines from a bull market’s Terminal Zero (TZ = a bull market’s last all-time high). The BEV plot shows that in 1999, Mr Bear clawed back 70% from the bull market high of January 1980.
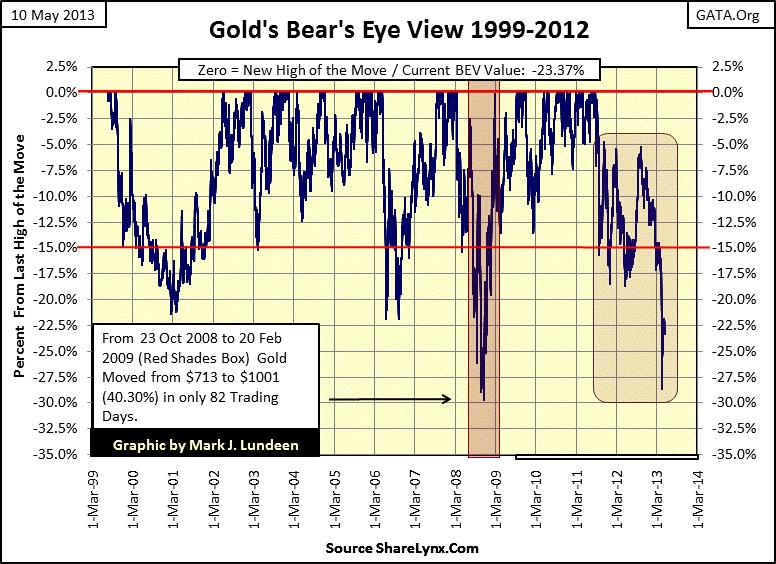
One point gold’s BEV plot makes very clear that is not apparent in gold’s price chart is how easy it has been to make money in gold since 2001, just buy it and hold it. Since 2001, gold has risen from a 70% bear market bottom with little of the massive volatility that was present in the gold market during its 1969-80 bull market. Unlike four decades ago, none of the current bull market's correction has exceeded 30%. This is something the Dow Jones cannot say for its 1982-2000 bull market as it saw a 36% decline in October 1987.
In fact since 2001, most of the time the price of gold has been within 10% of its last all-time high, as we can see below when we begin gold’s BEV plot series in 1999 at the actual gold bear market bottom. The fact is, if you were aware that gold frequently saw deep corrections during its 1969-80 bull market, and so didn’t freak out when gold declined less than 30% as it did in 2008, and now 2013, plus turned off CNBC anytime they covered gold as an investment, then holding gold since 2001 has been as easy as holding onto blue-chip stocks from the beginning of their bull market in 1982 to 2000.
Returning to gold’s BEV & Step Sum chart from 1969 to today (two charts up), let’s look at gold’s step sum (Red Plot Right Scale). The step sum is simply the sum total of the daily ups and downs in the price of gold. Up days are +1, down days are -1, and the step sum plot is the sum total of all the positive and negative 1s. This makes the step sum plot a single item A-D line for the price of gold that is useful to see what market sentiment expects of future market trends. Amazingly, in both bull and bear markets there are about as many up days as there are down days. But usually the step sum has a slight bias to the upside in bull markets, and to the downside in bear markets. But this is not always so, and that is what makes a step sum useful.
Two charts up we see gold from 1987 to 1996 was trending down as its step sum trended sideways. This created a step-sum bear box, where market sentiment (the step sum) was disagreeing with its price trend (market reality). Someone was wrong, and usually in a step sum bear box it is the price trend that has it right. In late 1996, gold’s step sum began its bear market catastrophic collapse as the gold bulls finally gave up, and this is clearly seen in the bear box. On a price basis, the bear market in gold ended on 19 July 1999 when gold saw its deepest decline from its January 1980 high: $253.70, or a 69.27% bear market bottom. But gold’s step sum still needed three more years to complete its collapse, which it did on 31 May 2001, with gold at $265.30.
Since May 2001, gold’s price and step sum trends have risen steadily, except during the 2008 credit crisis, and now since August 2011 to today. But during the credit crisis, gold’s step sum did decline as its price fell 29%, if not by much. However, since August 2011 gold’s step sum has broken with its price trend by trending sideways for over a year and a half now, forming another bear box seen in the short-term chart below.
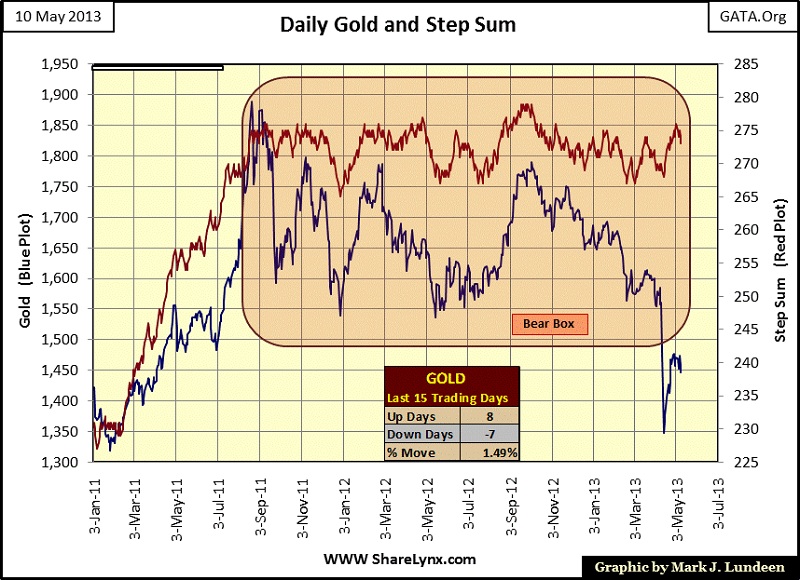
The question now is whether or not gold’s step sum intends to collapse or not. A net 15 down days this summer to 260 would do it, and the price trend would not necessarily have to go down to accomplish this beneficial technical action. But gold and silver bulls are always damn stubborn. It took the gold bulls eight years before they ran up the white flag in the 1987-96 bear box.
Well, we can only play the cards we are dealt with, and currently with market sentiment, as measured by gold’s step sum stuck in neutral, I believe the low of April 15 will hold as the bears in the paper-gold futures markets must be exhausted after April. It is a bull market after all, and ultimately bears don’t prosper in bull markets. But there might not be much excitement in the gold market for us bulls until we once again see more net up-days taking the price of gold up with its step sum as we see in the chart from January to August 2011. If gold is in a bull market, and it is, in time we will see this happen, and silver will prove to be more profitable than gold as the SGR descends to new bull market lows in its own good time.
More from Silver Phoenix 500


