Silver Is Insurance Against The Worst Part Of This Depression


The worst part of the world’s ongoing financial crisis is still on the way: A crisis that has its roots in the debt-based monetary system. The debt-based monetary system has facilitated the growth of debt to levels that will inevitably bring total collapse.
Every day we see more and more events (think Greece, Deutsche Bank, etc.) that suggest that the total collapse is very close. The number of these will increase over the coming months, while their extent will also greatly magnify.
The high debt levels are a huge burden that will strangle the world economy, since future production is reduced by debt obligations. That is just how it works. When you have huge debt, you will have less of your future income/production available due to the debt obligation that has to be met.
These debts will have to be settled. There will be no progress (growth in economy) until debts are settled. The settlement of these debts is that “worst part” of the financial crisis. The majority of these settlements will occur as the stock market collapses, and currencies/banks fail (the collapse is the settlement). This will be the greatest depression.
The crisis cannot be stopped, but you do not have to be caught up in its worst effects. Silver, as I have previously explained, is virtually the opposite of debt and, therefore; great insurance against the coming debt (particularly: stock market, currency and banking system) collapse. It is for this reason that the chart for silver prices is looking so bullish, whereas the charts for the Dow and other goods are looking really bad.
Below is a comparison of Dow Index charts (1920s vs 1998 – 2016):
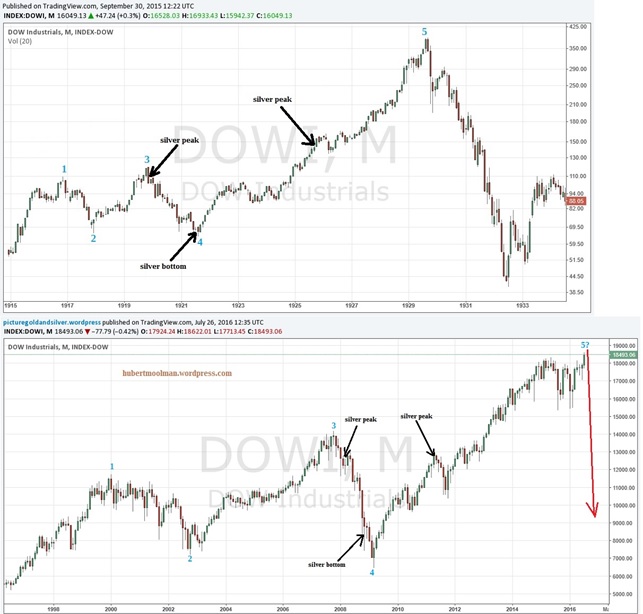
Above is a fractal comparison between the current period (1998 to 2016) and the 1920/30s for the Dow Index (charts from tradingview.com). Follow the two patterns marked 1 to 5, on both charts. I have also indicated where silver peaks and bottoms occurred to show that both patterns exist in similar conditions. This means that there is a strong likelihood that the crash will occur.
The Dow is looking for that peak at point 5 (on the current pattern) from where it could free fall, much like the October 1929 crash. The Dow has stayed at these peak levels for longer than I expected. However, this appears to be what is needed to get most people believing that the 7-year rally will continue (a classical set-up for a massive collapse).
Below, is a short-term chart of the Dow/Silver ratio (from tradingview.com):
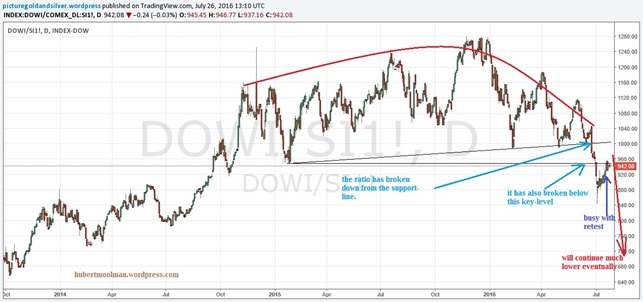
The ratio has broken down from the support-line indicated. It has also broken below the key-level highlighted. The fact that the Dow’s recent rally is represented by a retest of a breakdown of this ratio, instead of a retest of a breakout, supports the likelihood that the Dow’s recent rally is fake.
Once the retest of the recent breakdown is complete; this ratio will decline very fast, as will the Dow. This decline is supported by a more longer-term analysis of this ratio.
Below is a fractal analysis for silver:
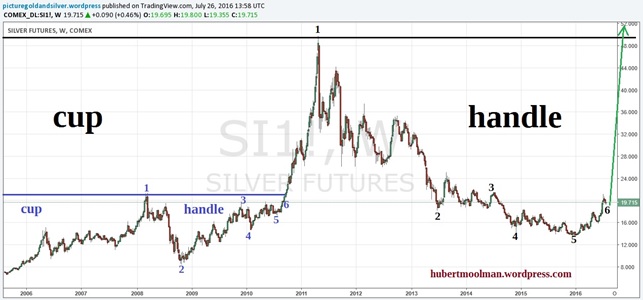
On the silver chart, I have highlighted two patterns that appear similar. I have marked them 1 to 6 to show how they might compare. Both patterns start from a significant silver top. Both patterns represent the end part or handle of a Cup & Handle-type pattern. If the comparison is justified, then we are currently just after point 6, the point where a major breakout occurred.
We will likely see much higher silver prices over the coming months.
********
For more of this kind of analysis, you are welcome to subscribe to my premium service. I have also recently completed a Gold Mining Fractal Analysis Report as well as a Silver Fractal Analysis Report.
More from Silver Phoenix 500


