Silver Market update - What To Expect Ahead Of The Epochal Silver Breakout...


I want to commence this update on silver by pointing out something that is actually rather amazing. Despite its impressive gains of the past several months, the massive bull market that is soon to unfold before us hasn’t even started yet. You will understand why I say that when you look at the great “Chart of the Ages” presented below. This chart shows that silver is now very close to completing an epochal 45 year Cup & Handle base pattern and while it could yet take a month or two to complete its break out from it, what’s a month or two after 45 years??...
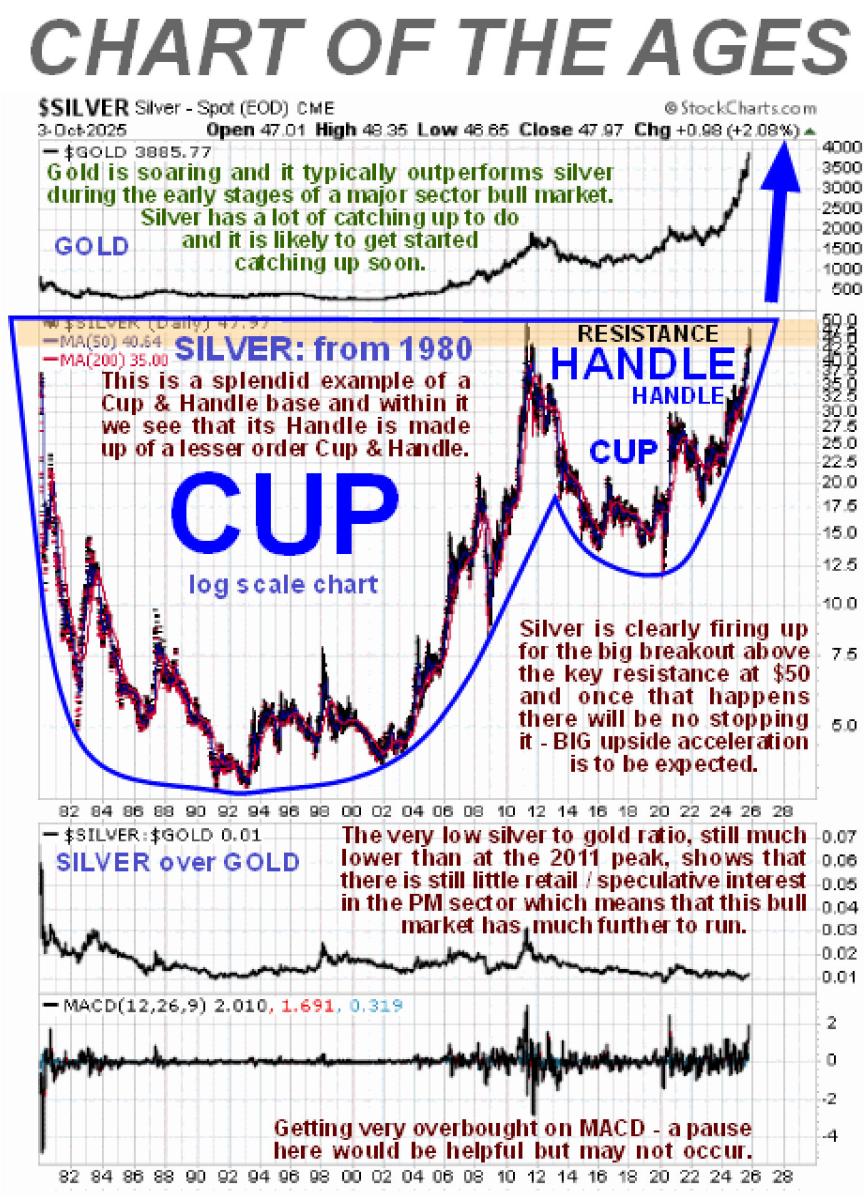
Now, this is important. The bull market resulting from the breakout from this giant pattern will be at least equal in extent to the height of the pattern from top to bottom measured on this log chart. What this means is that silver is headed into the hundreds of dollars – could be $300, could be $500 or much higher, the exact figure doesn’t matter – what matters is that silver investments such as the stocks of silver producers are going to moonshot as a result, and that could happen relatively quickly. Before moving on from this chart there are a couple of other important positive points to note. One is that gold, shown at the top of this chart, is already rocketing higher, and where gold goes silver follows and it is very clear that the positive action in gold will encourage silver to get on with it and break out of this pattern before much longer. The other important point is that the silver to gold ratio, shown towards the bottom of the chart, is still at a low level – much lower than it was at the 2011 sector peak – which means that this bull market still has much further to run.
Now we will zoom in to consider the latter part of the Chart of the Ages by means of another long-term chart, this time “only” going back to the start of this millenium, i.e. to the start of the year 2000. When we look at these two charts together we realize that the great 2000’s PM sector bull market saw silver rally to complete the right side of the enormous Cup & Handle base shown on the 45-year chart and therefore, despite that big powerful uptrend in silver that ran through the 2000’s resulting in impressive gains, it still hadn’t broken out of the gigantic base pattern shown on the 45-year chart! and the great news for investors here is that it will achieve this feat before much longer. Before leaving this chart from the year 2000 observe how silver’s rate of advance has accelerated in recent months which is because there isn’t much resistance left to overcome before it breaks out to clear new highs. We should note however that it is already quite heavily overbought (MACD) so we could see a final near-term consolidation / reaction before it makes a clear breakout that is designed to shake people out before breakout occurs.
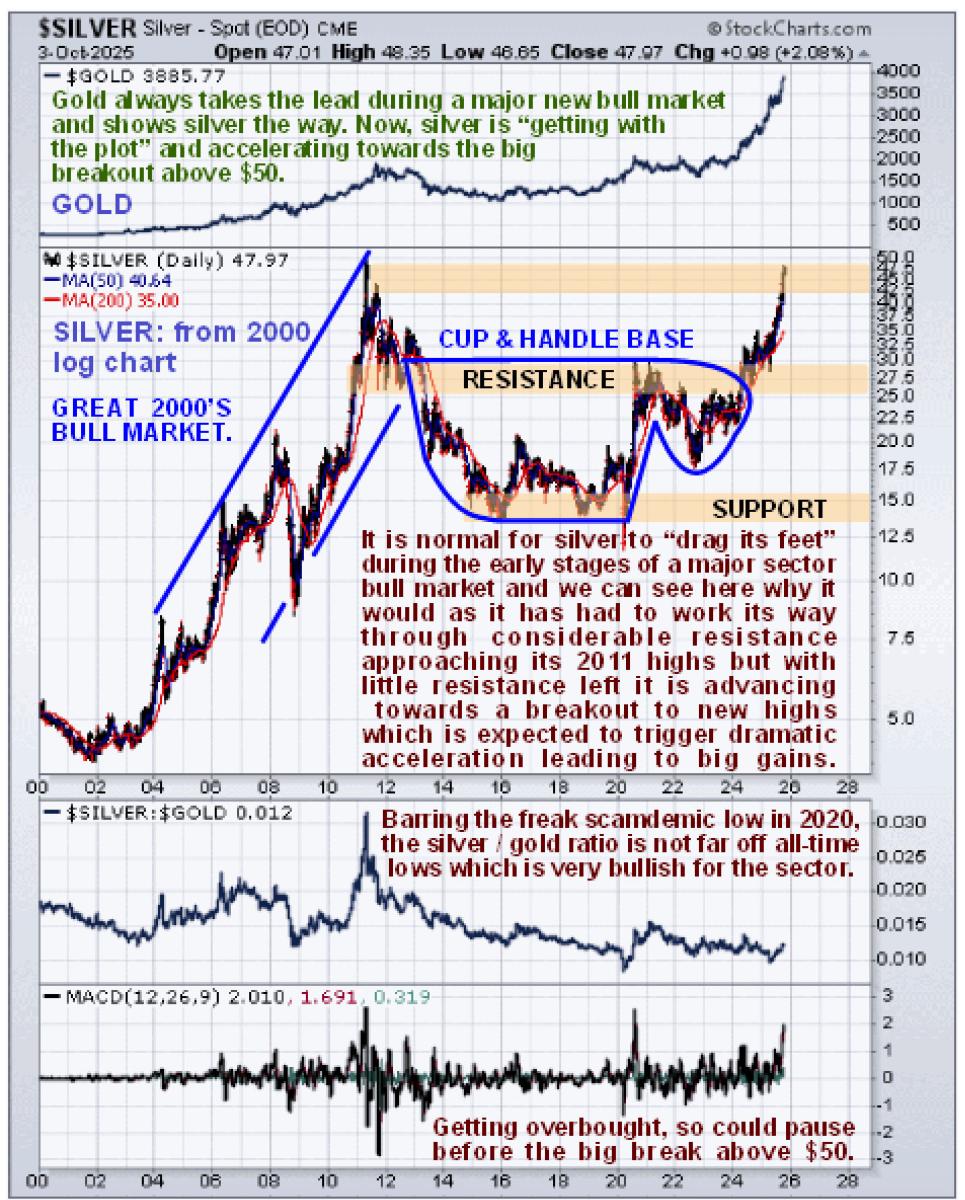
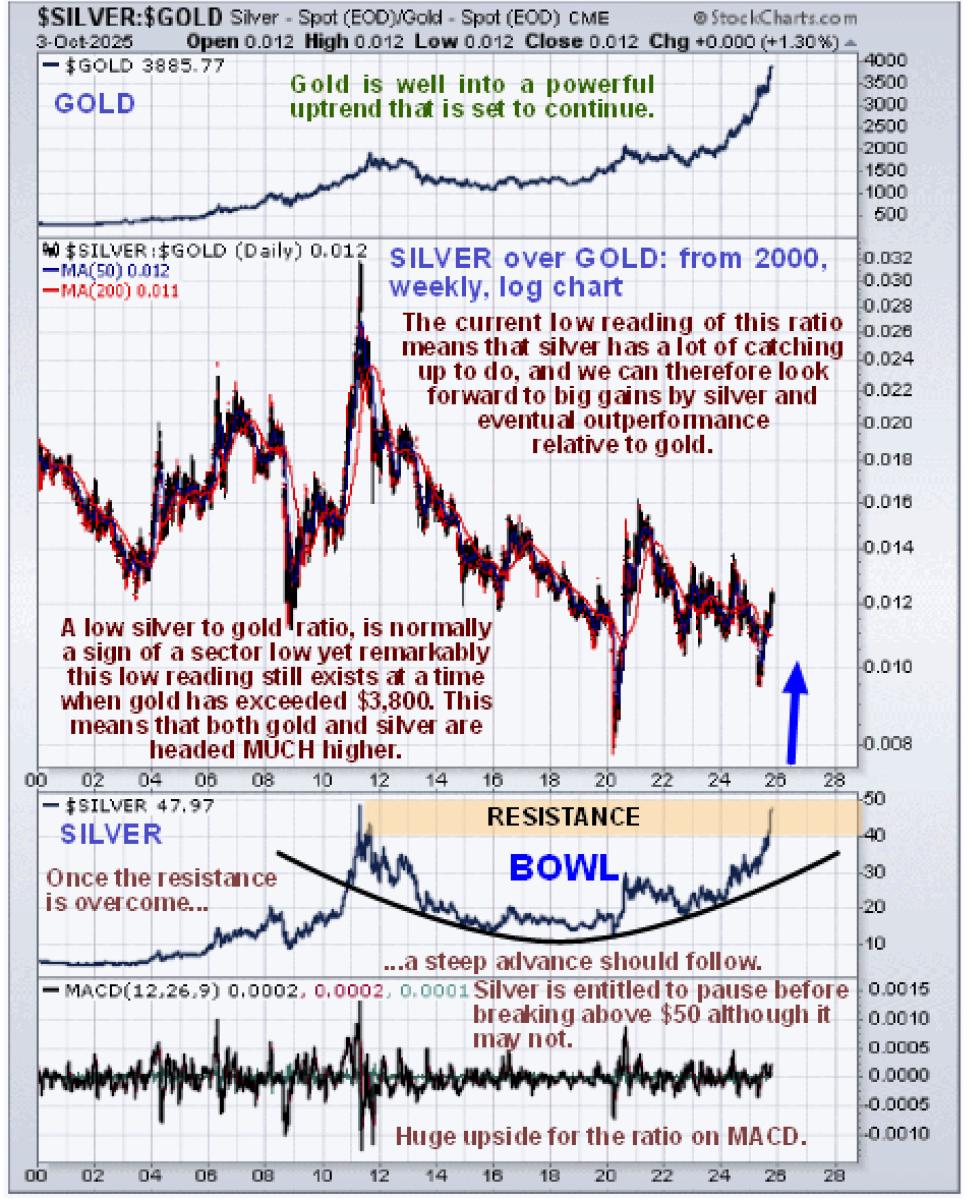
Despite gold’s big gains since early last year and silver’s gains, especially over the past several months, the silver over gold ratio remains at a low level as shown on the ratio chart below - it has picked up some, but not much – which reflects the fact that, despite the improvement, retail / speculative interest in the sector remains subdued which is of course very bullish – only when they show up in droves as in 2011 will we need to become concerned.
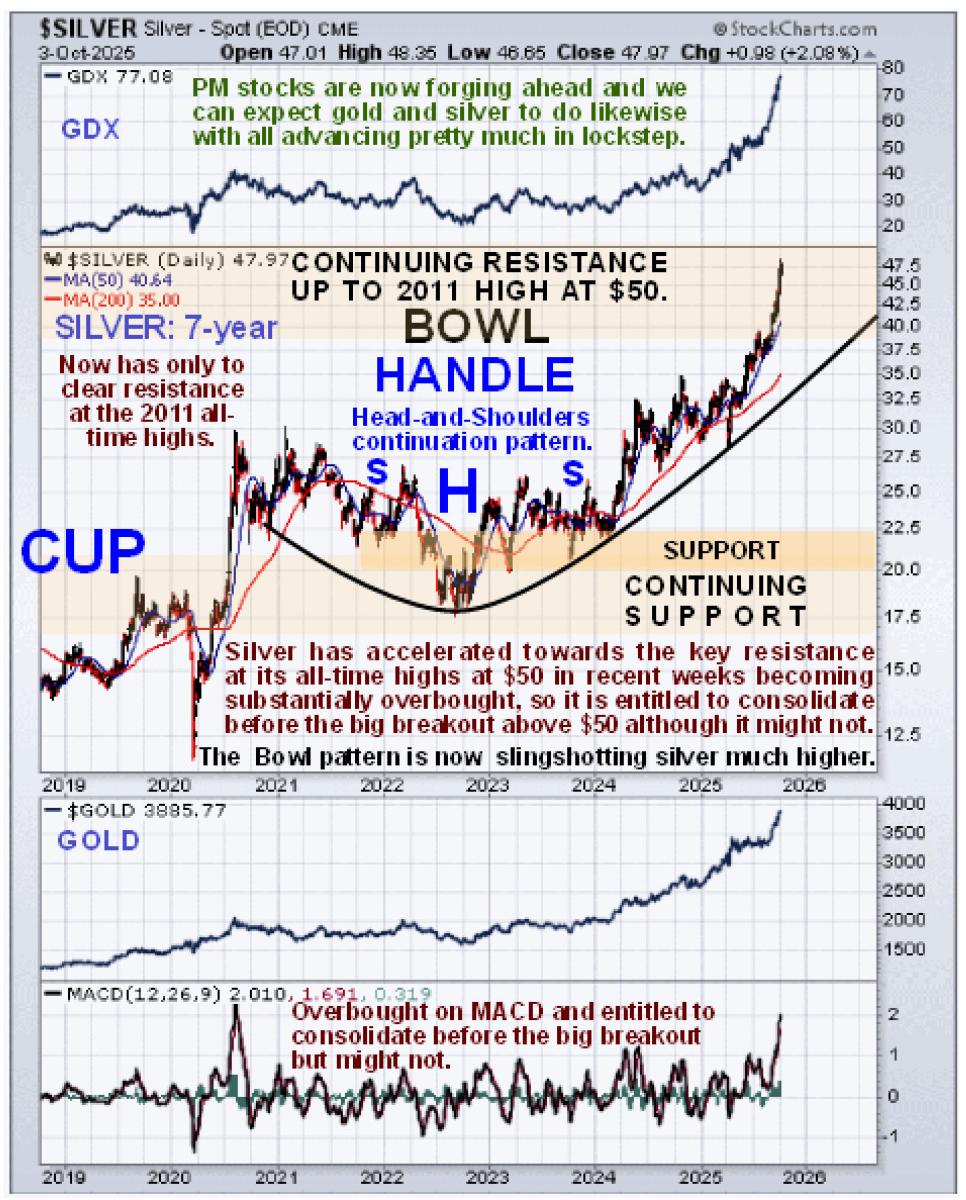
Zooming in again via a 7-year chart we see that silver has been driven higher since early 2024 by the ascending boundary of a Bowl pattern with it running well ahead of the Bowl boundary in recent months to arrive at the final resistance at the 2011 highs in a very overbought state. Ideally we would like to see silver consolidate or react back some over the near-term to work off this overbought condition which would be a healthy development that would set it up for a decisive breakout with follow through. However, with an attack on Iran looking imminent following a closed door meeting of the Generals and Netanyahu travelling to Washington to give Trump his marching orders, silver may be granted little time to stop for a rest. If nothing happens on this front short-term and markets breathe a sigh of relief over the Gaza peace plan, then we could see a sector reaction. As many of you are doubtless aware “you need eyes in the back of your head” in this game and one possibility that we should be aware of is that a sudden attack on Iran, which will be a much more grave development than the 12-day war earlier this year, because it will involve heavy US involvement and set the whole region of fire, could very well trigger a broad-based market crash with the metals being temporarily dragged down too. This is why it is recommended to pull in close stops to protect the big gains we have garnered in recent months and sidestep this risk, putting us in a position to swoop and scoop up bargains later. A method of setting stops will be set out towards the end.
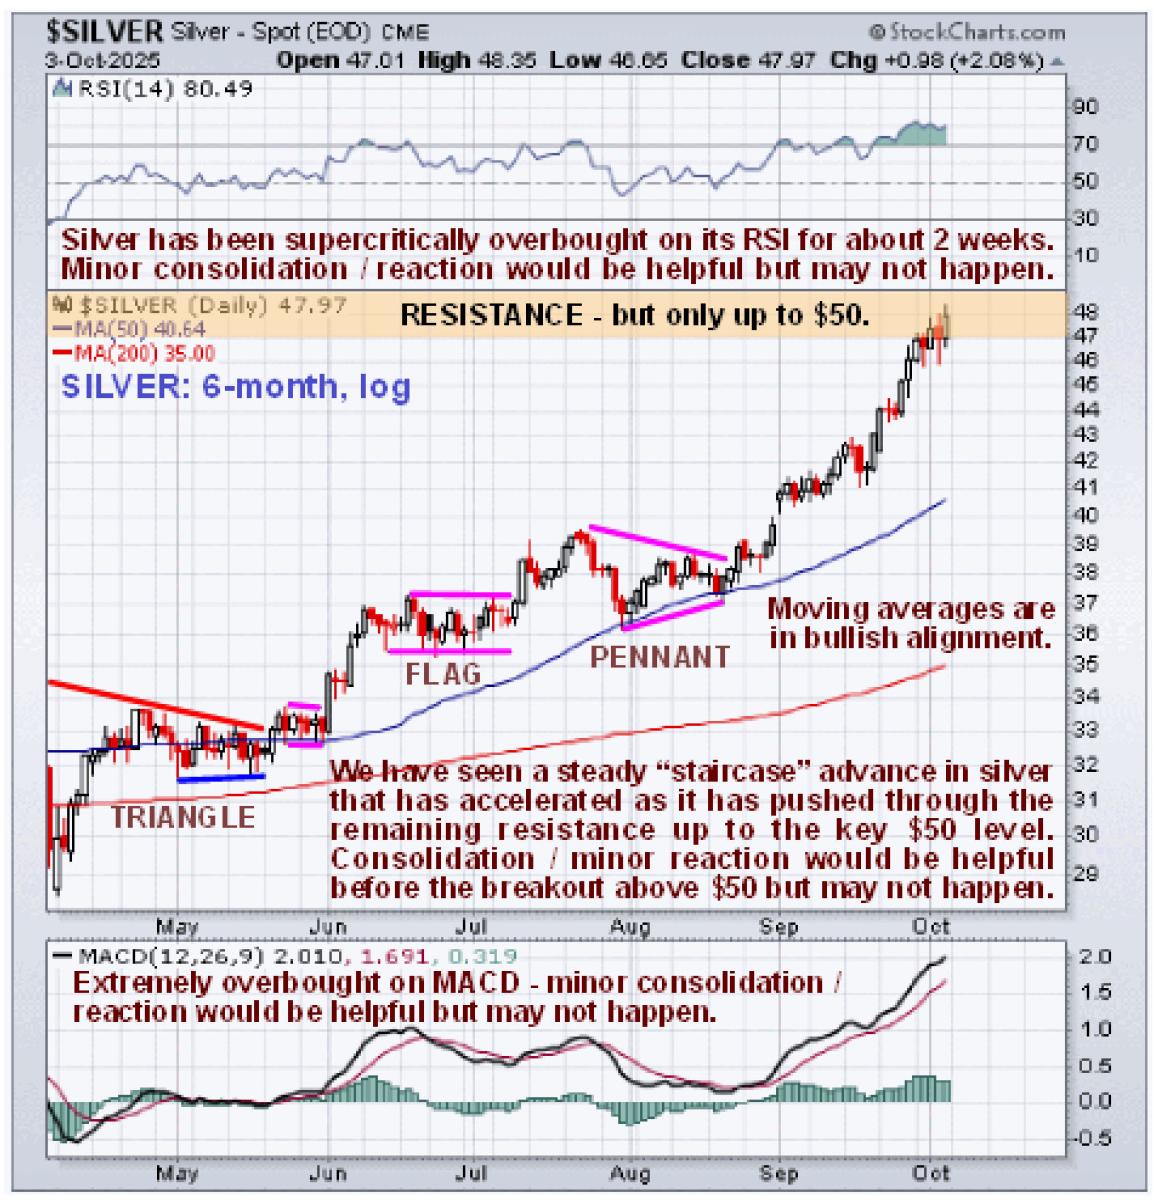
Zooming in yet again via the 6-month chart enables us to see recent action in detail. Here we see that the picture is entirely bullish with silver having been advancing in a “staircase” pattern towards the key resistance at the $50 level, the only reservation being that it has arrived at this resistance in a heavily overbought state, on its RSI indicator which has been in a super-critically overbought condition for about 2 weeks and on its MACD indicator with a large gap having opened up with the 200-day moving average, all of which increases the risk of a period of consolidation / reaction, which as mentioned above would be a healthy development ahead of the big breakout and if there is a reaction it would present a great opportunity to buy or add to positions.
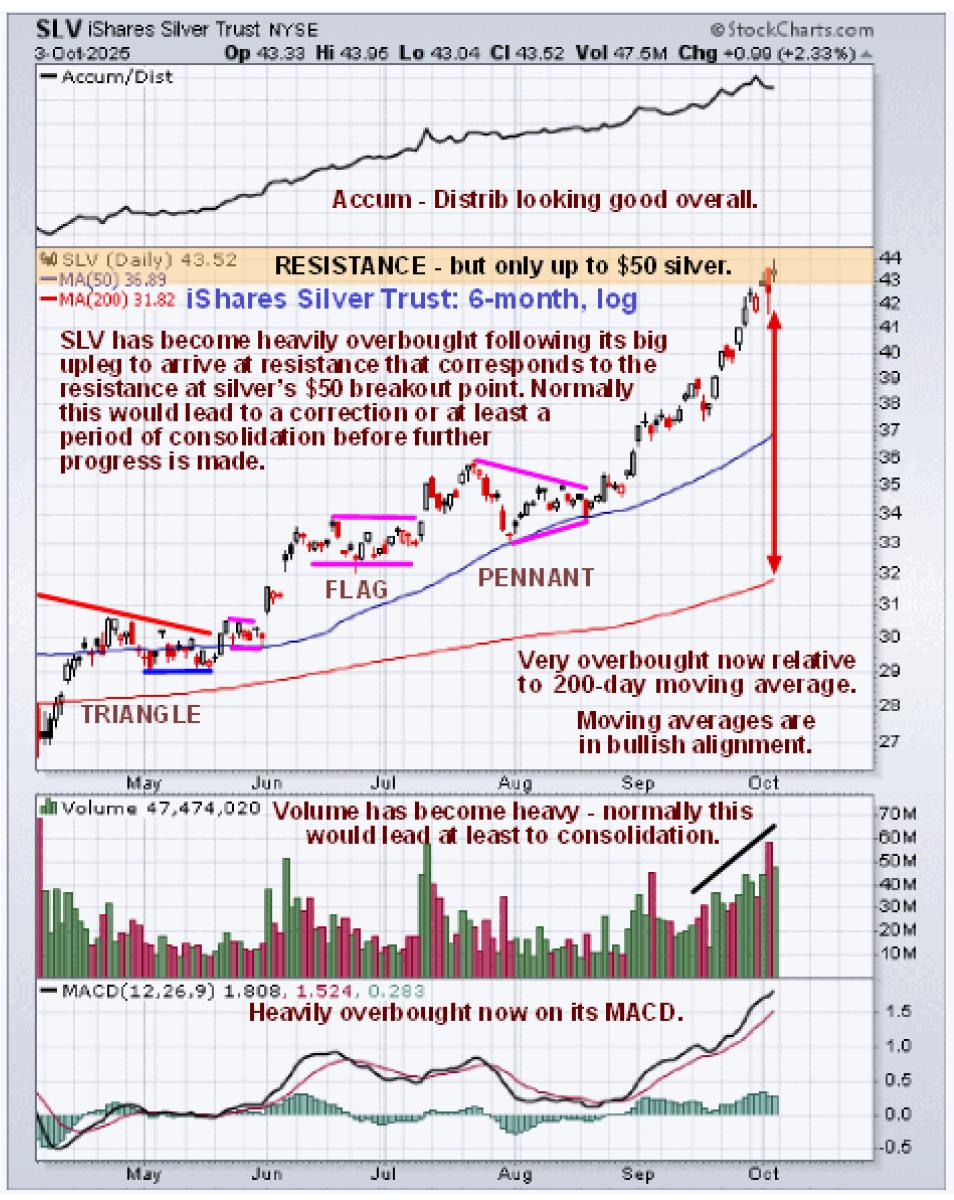
The 6-month chart for silver above lacks volume and as a result, volume indicators but we can get around that by looking at the 6-month chart for reliable silver proxy iShares Silver Trust (SLV). On this we can glean the additional information that volume has built up to become quite heavy over the past several weeks which also makes a period of consolidation / reaction more likely.
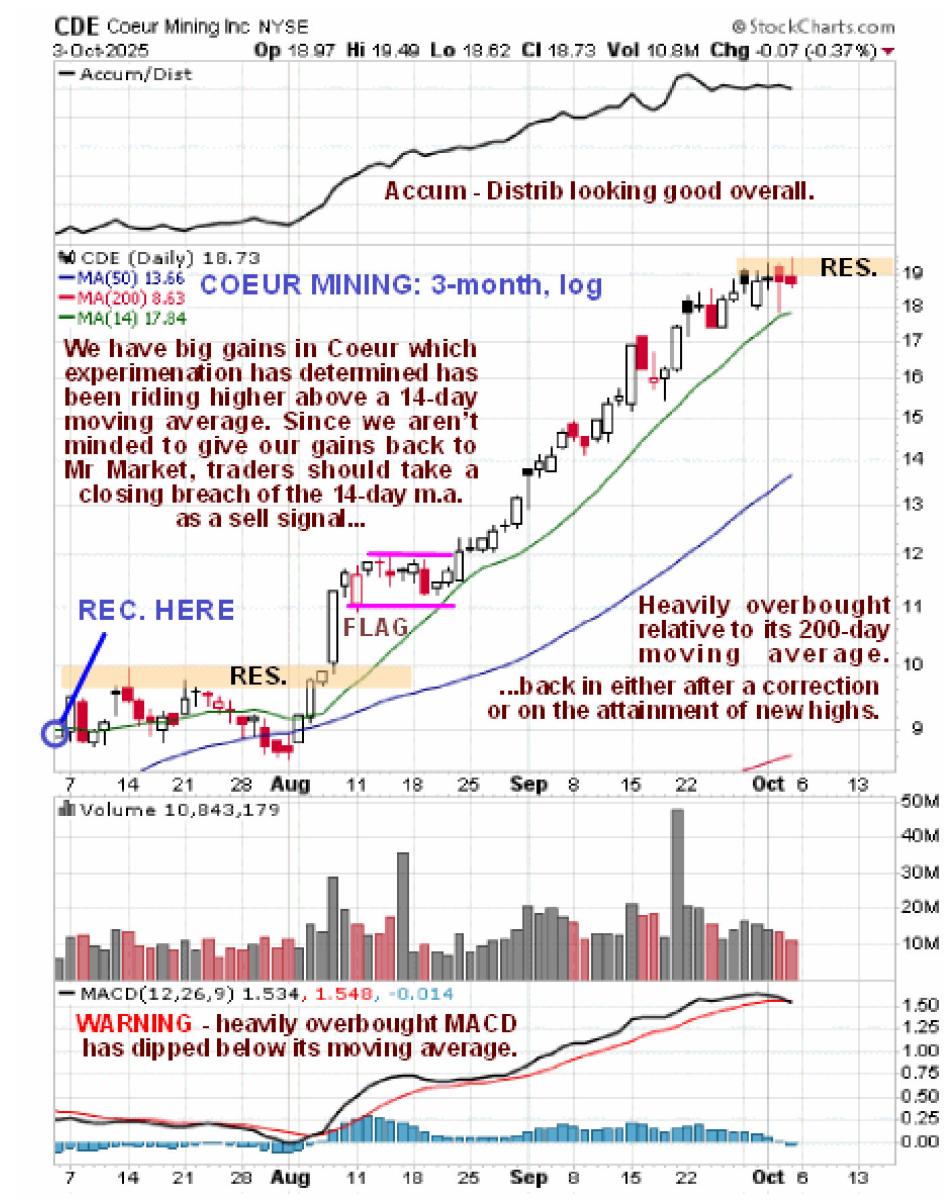
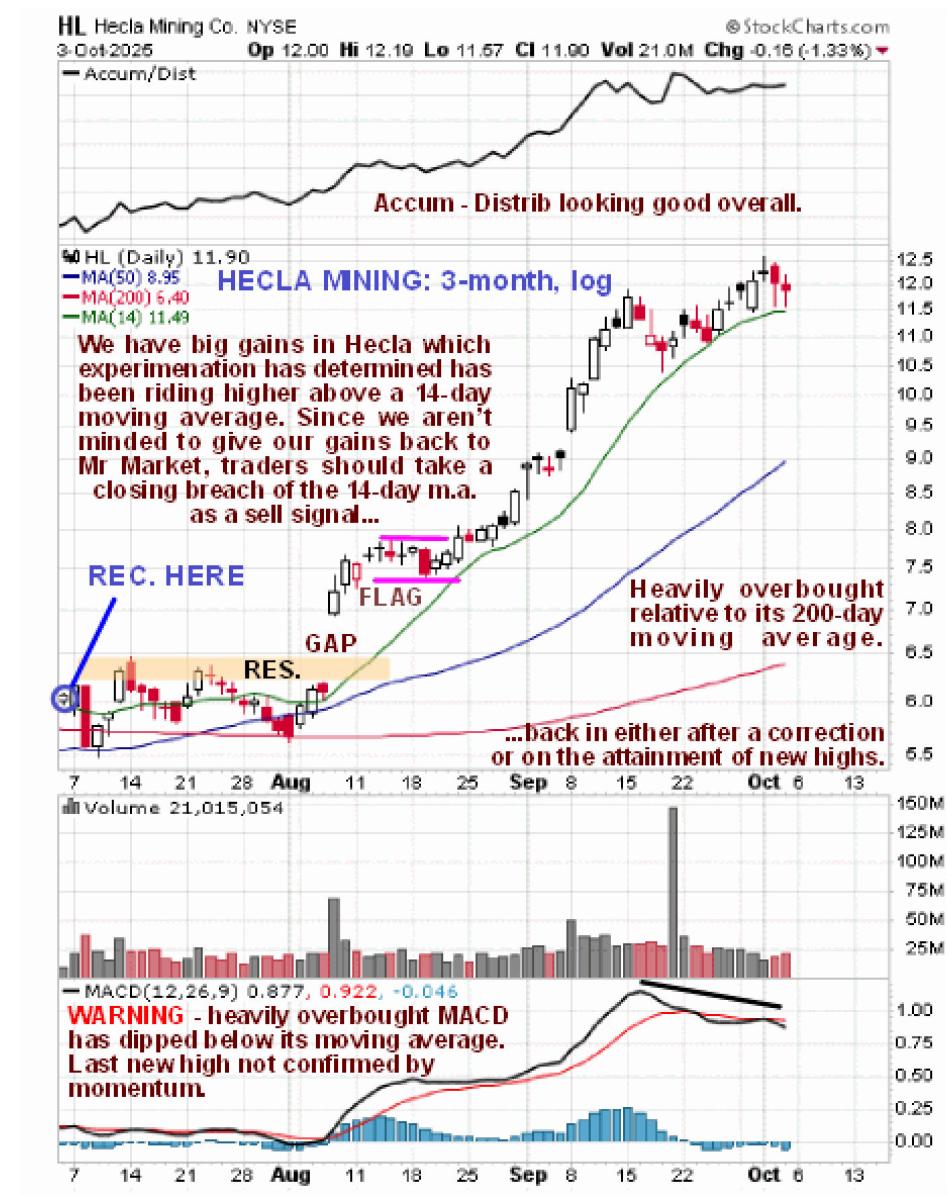
So what can we do to make sure that our big profits to date are not plundered perhaps to a significant extent by Mr Market at this critical juncture? – simple – pull in close stops. In particular I have observed that in the case of 2 of our stocks where we have sizable gains over the past several months, Coeur Mining and Hecla Mining, they have been riding their respective 14-days moving averages upward, and this no doubt applies to a number of other stocks across the sector. Therefore, if holding, you have the option of placing a closing stop a little way below this average, accepting that there is some risk of being shaken out. If the stop is triggered you then either wait until the dust has settled after a selloff, that could be sharp if this average is breached, or alternatively buy back if the stock turns around and closes at a new high. This way you protect your profits and make sure you stay in the game. Charts for Coeur Mining and Hecla Mining are shown below with 14-day moving averages added.
Even though silver has yet to break out to all-time new highs, we have not “let the grass grow under our feet” in recent weeks, as the following Before and After charts of recent trades makes abundantly clear…
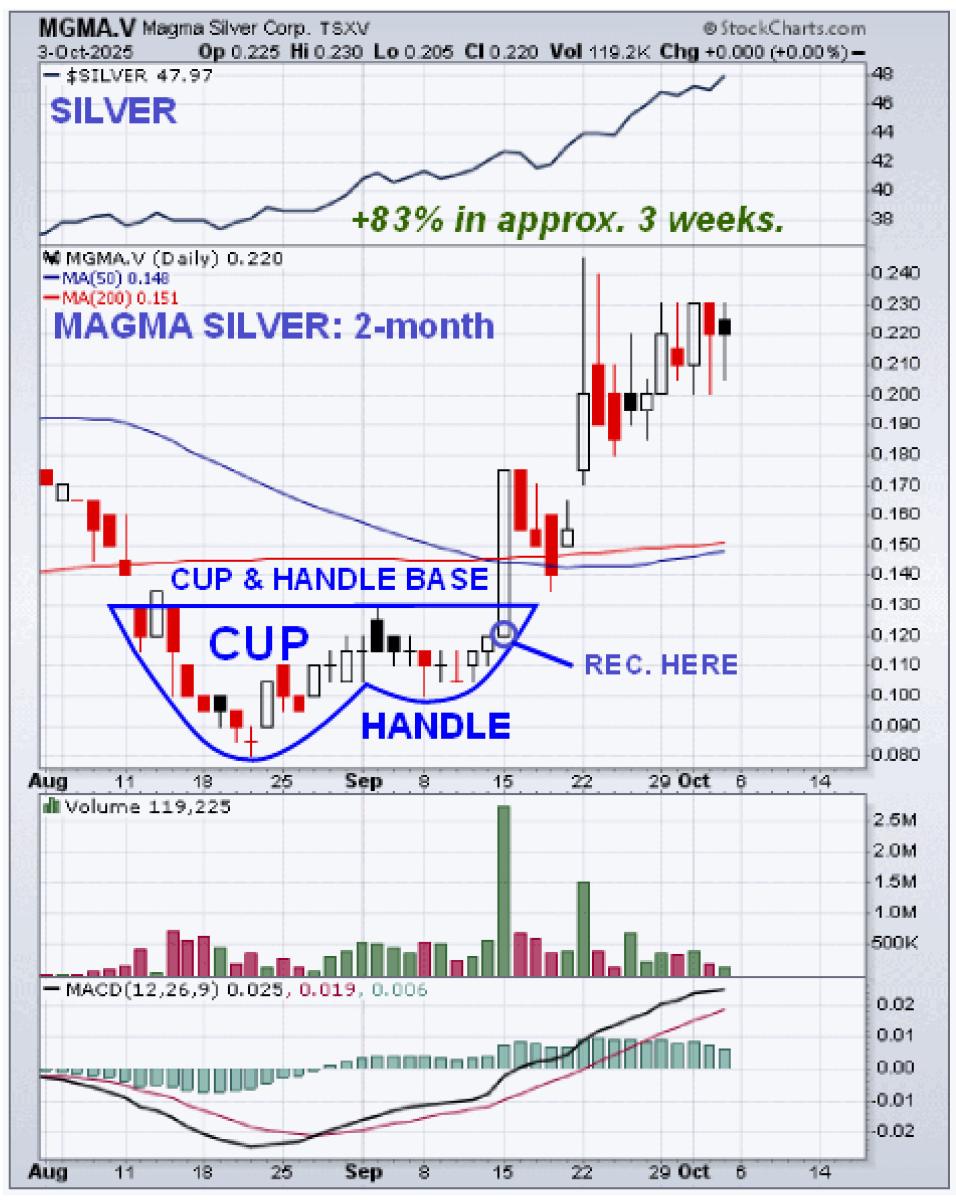
Bought Mag Silver Corp on 14th September at open at C$0.12…
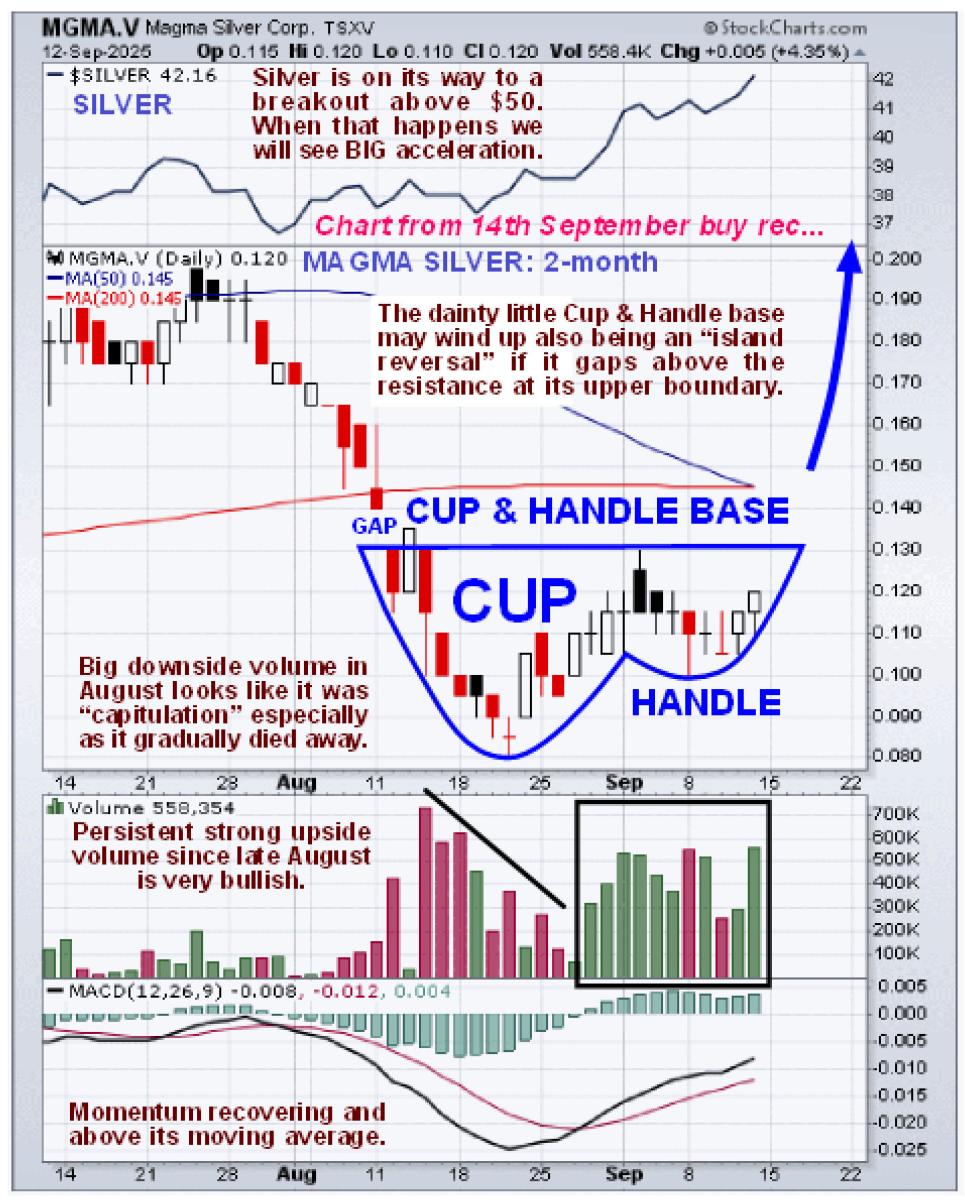
Here’s what happened…
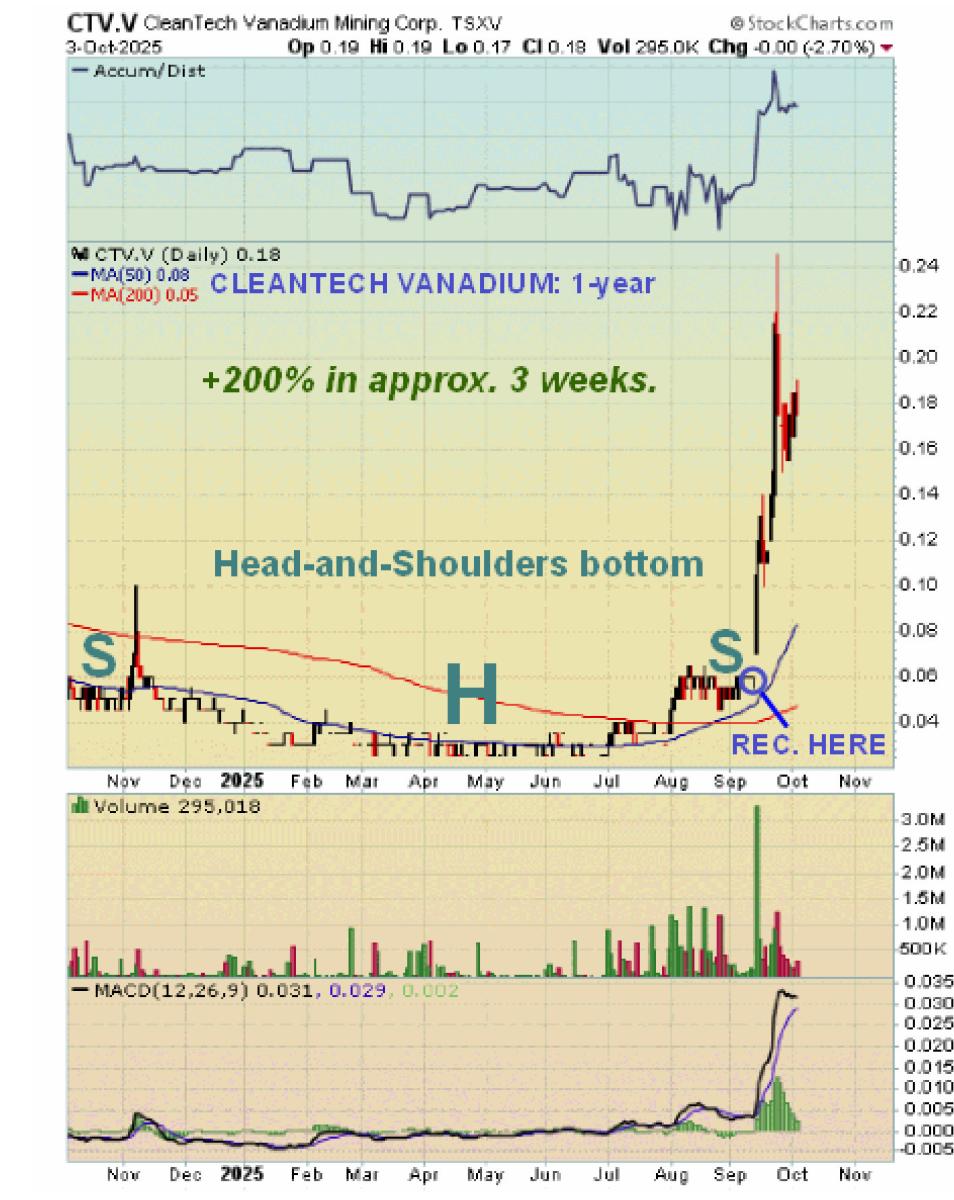
Bought CleanTech Vanadium on 15th September, recommended at C$0.06, gapped to C$0.07 at open…
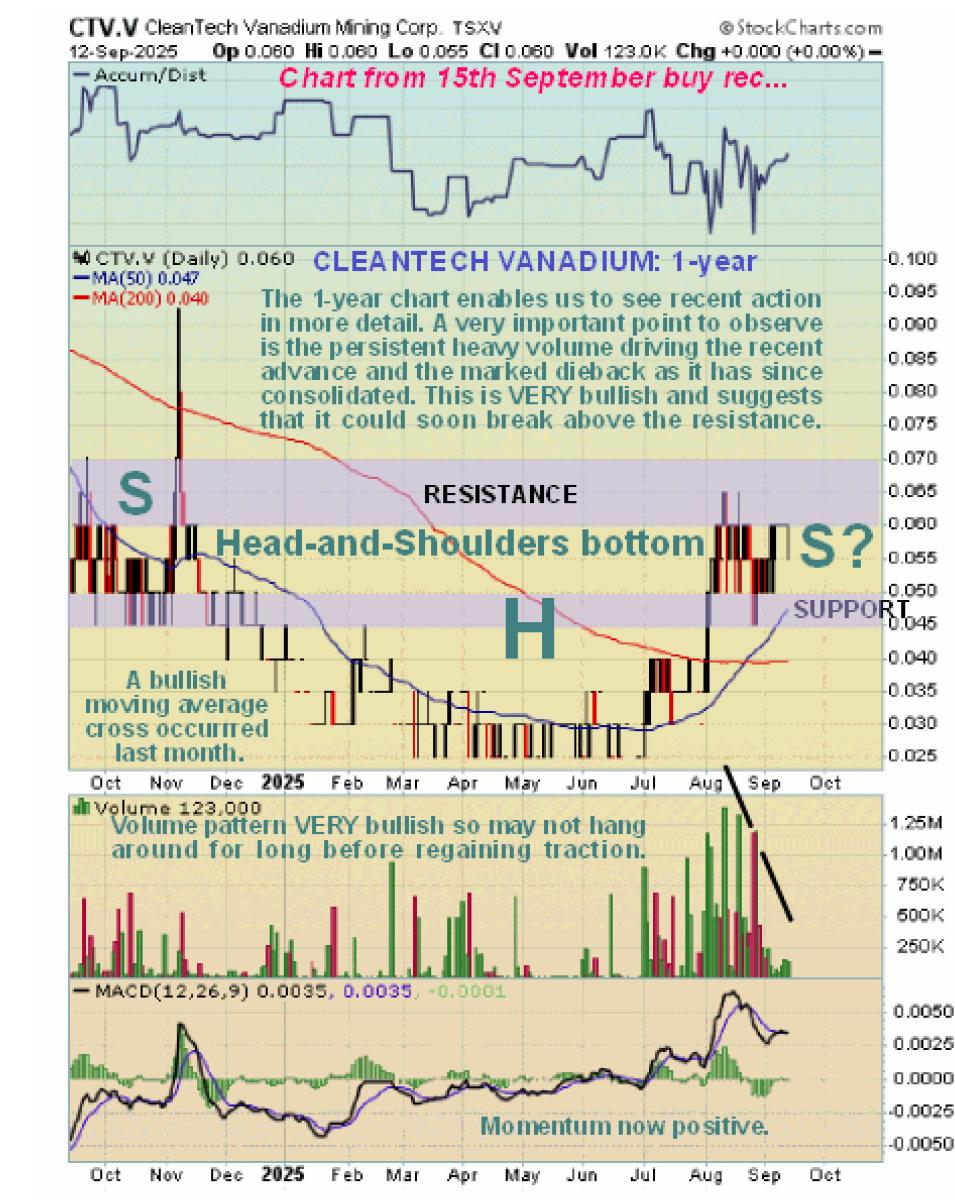
Here’s what happened…
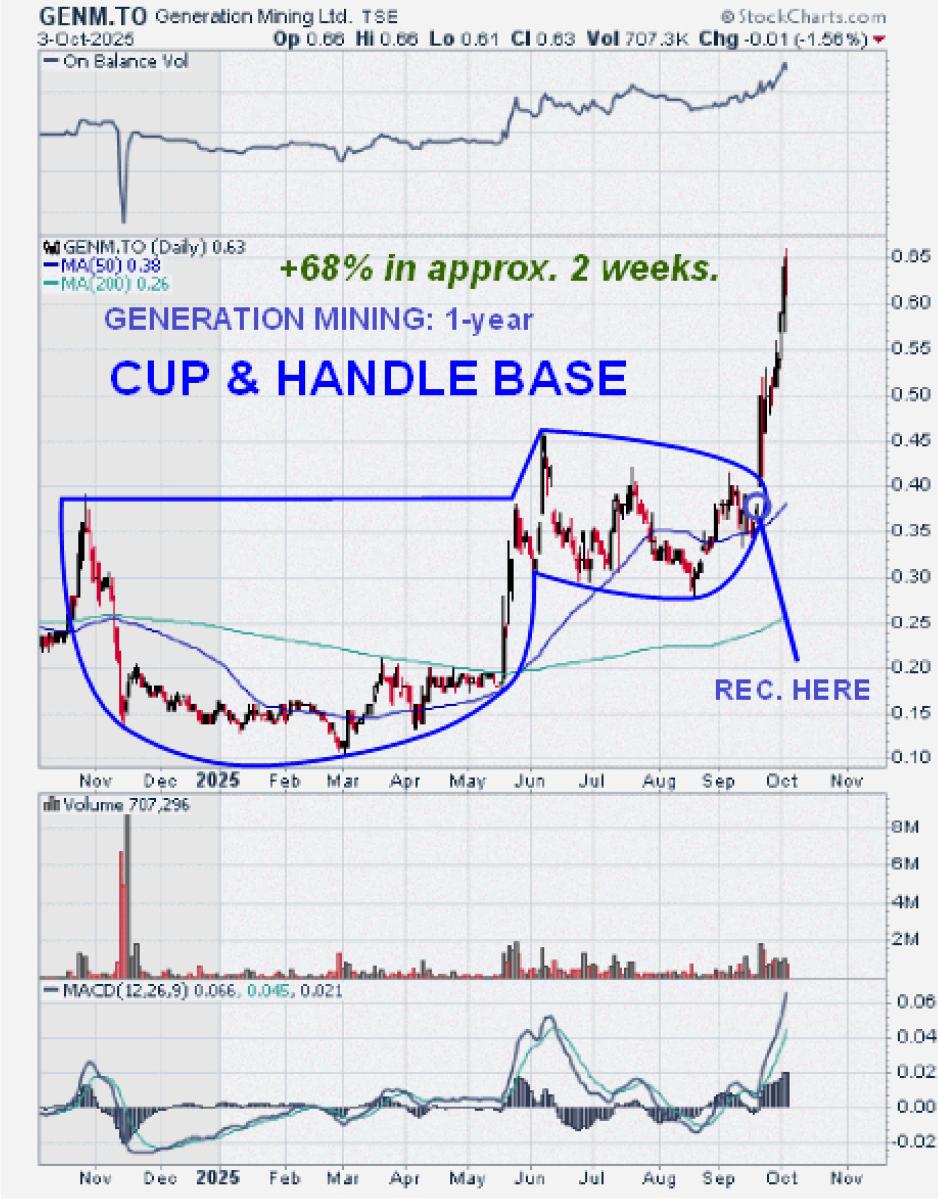
Bought Generation Mining on 22nd September, recommended at C$0.375, gapped to C$0.40 at open…
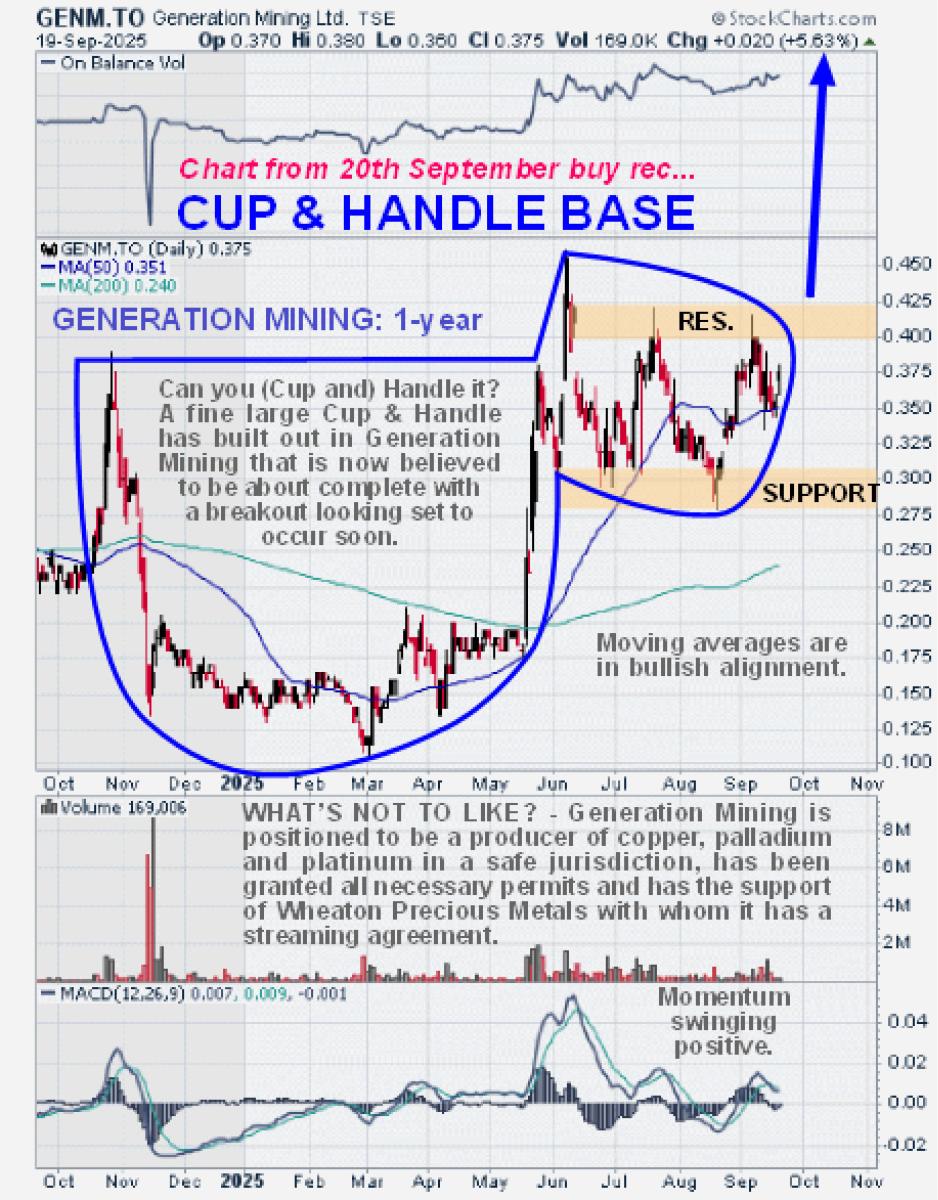
Here’s what happened…
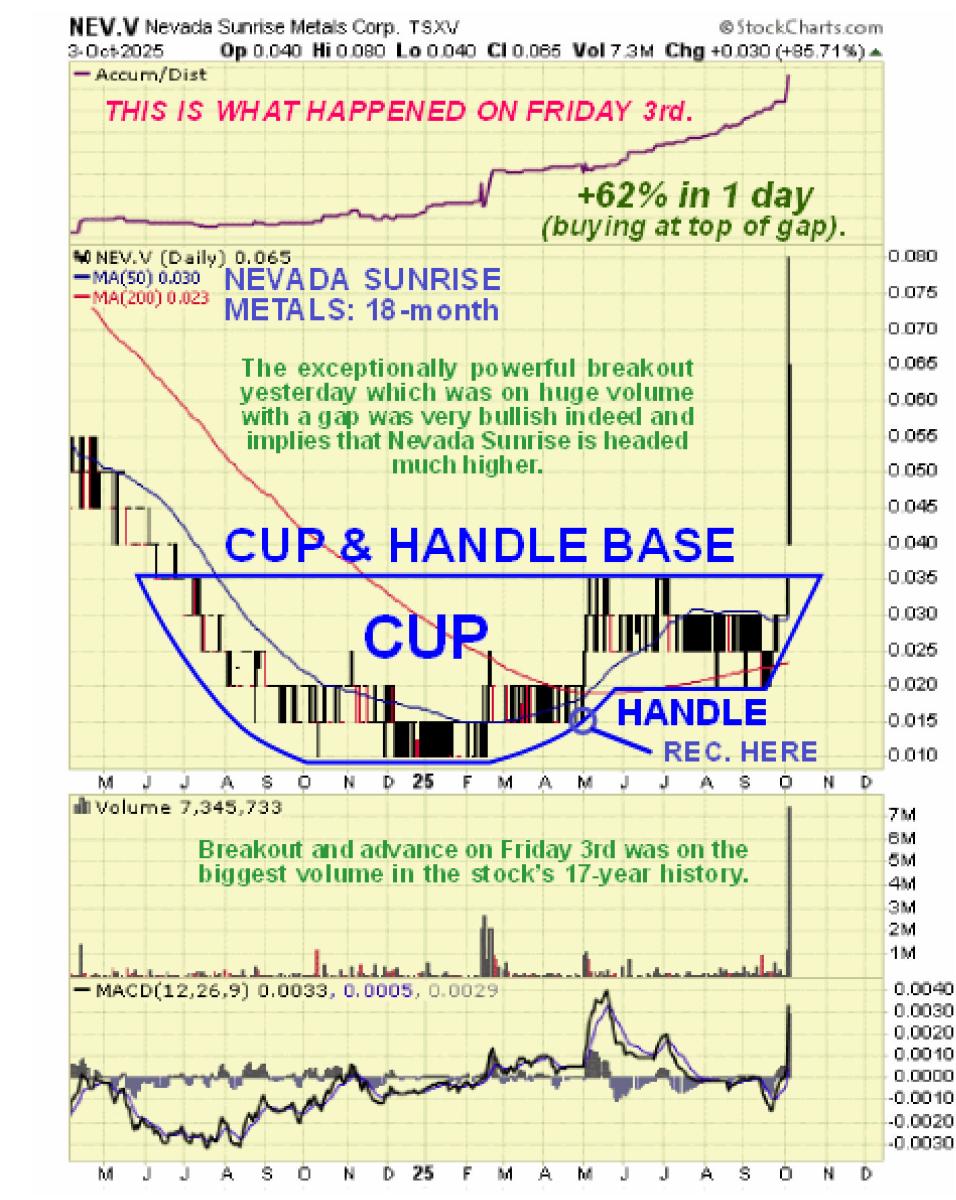
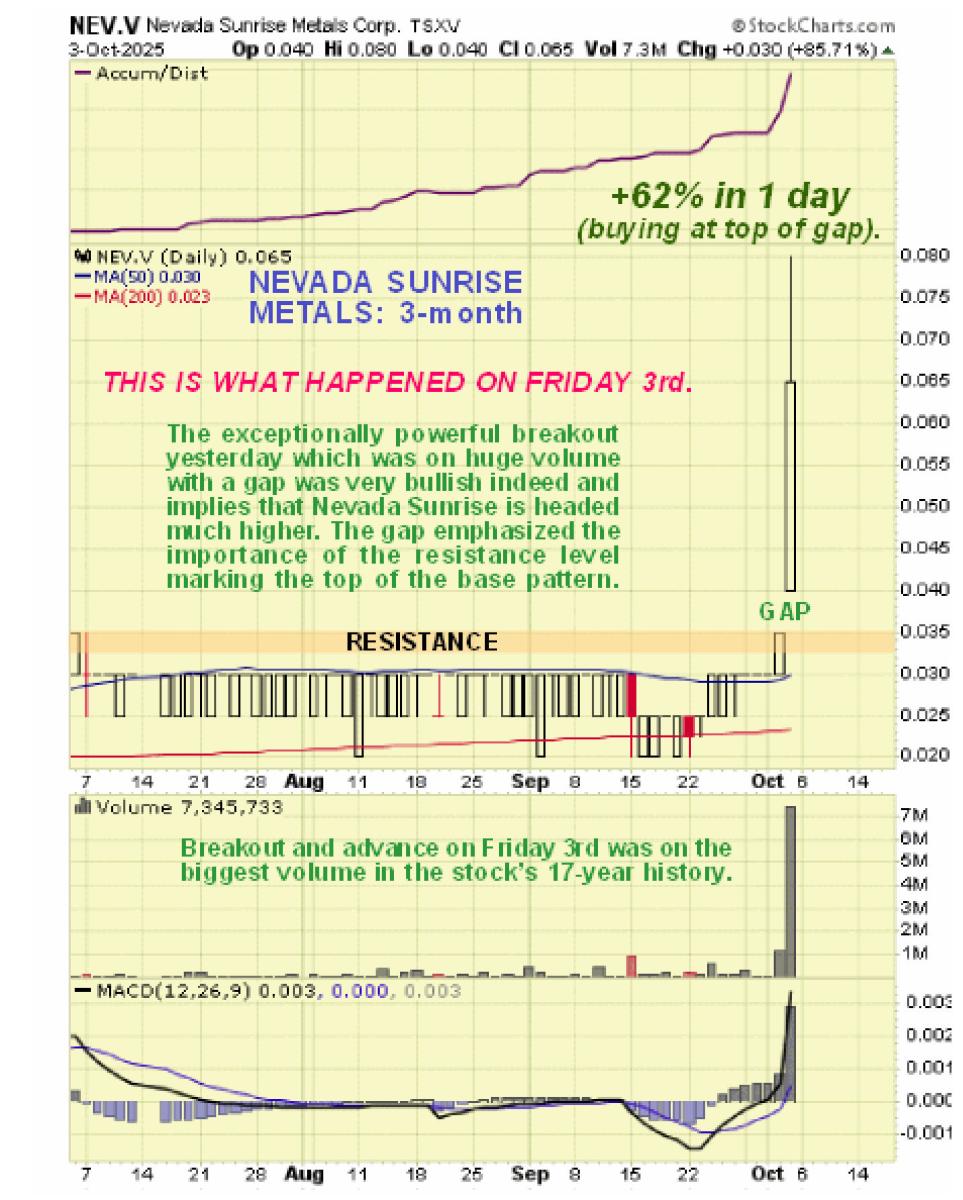
Bought Nevada Metals (again) on 3rd October (last Friday), recommended at C$0.035, gapped to C$0.04 at open.
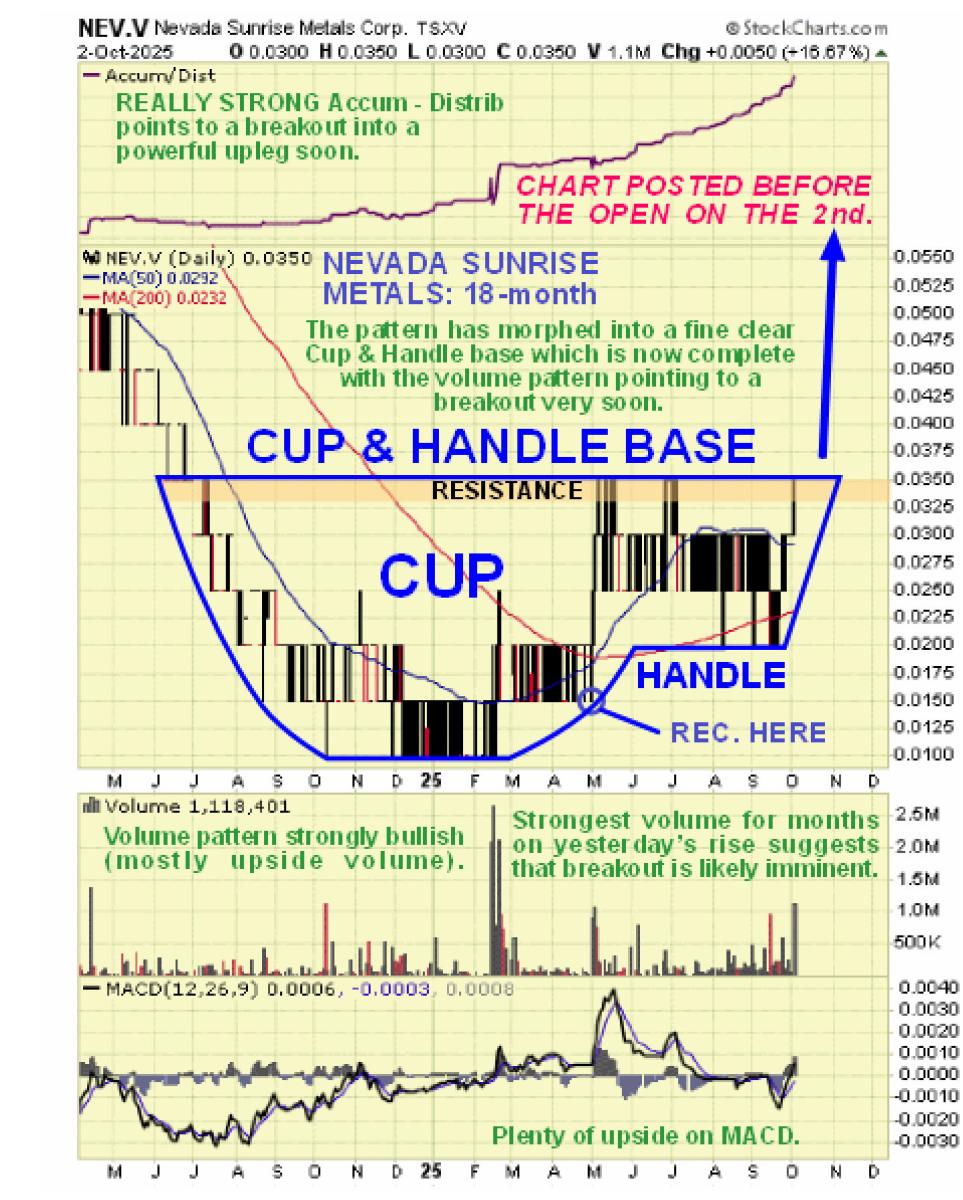
Here’s what happened…
The debt and money creation situation is now in its final terminal stage after being on life support since 2008. If they halt exponential debt expansion and money creation the system will instantly lock up and we go Mad Max. If they keep it going we quickly move into hyperinflation which is already starting and end up Mad Max only slower. Regardless of its paper price, silver will retain its intrinsic value no matter what. The strategies set out here are intended to enable you to capitalize on the situation to the maximum extent whilst affording protection whichever way it goes.
********


