Silver Miners’ Q1’21 Fundamentals


The silver miners’ stocks have mostly been consolidating high since last summer. While they’ve enjoyed some sharp rallies, those have been within that sideways-grind trend. That lack of overall upside progress has left this tiny contrarian sector out of favor, with apathy reigning. But as their recently-reported Q1’21 operating and financial results revealed, silver stocks’ fundamentals and upside potential remain good.
There aren’t many major silver miners in the world, and only a handful are primary silver producers that derive over half their revenues from silver. With such a small population, there are only a few silver-stock ETFs. The leading one is still the SIL Global X Silver Miners ETF, which is also this tiny sector’s best benchmark. But nearing the end of Q1’21’s earnings season in mid-May, it only held $1.3b in net assets.
Following a mighty upleg that peaked in early August at SIL $51.53, the silver stocks have largely drifted laterally since. But their high trading range has been wide, encompassing both corrections and attempts at new uplegs. Plenty of speculators and investors are still interested in this obscure sector, as evidenced by an amazing episode in late January. That catapulted SIL a blistering 23.9% higher in just three trading days!
That was when Reddit’s famous wallstreetbets forum appeared to be starting to discuss engineering a silver short squeeze with massive retail buying. At the time I wrote a whole essay analyzing that. For our purposes today, that fascinating event proved that the right catalyst can still ignite big inflows into silver and its miners’ stocks. Unfortunately SIL resumed correcting after that, slumping on balance into late March.
But since then it has recovered, mirroring gold stocks’ march higher in a young upleg. By mid-May as last quarter’s earnings season was wrapping up, SIL had rebounded 18.7% in six weeks to $45.97. While that lagged gold stocks, it still made for a technically-sound upleg carving series of higher lows and higher highs. But back in Q1 SIL actually fell 12.5% despite that Reddit spike, fueling much bearish sentiment.
How were the major silver miners actually faring fundamentally while their stocks corrected with silver? Their weak stock-price performance was reasonable, as silver was dragged 7.4% lower that quarter by gold’s own 10.0% slide. The silver stocks normally amplify material gold and silver moves due to their inherent profits leverage to those precious metals. But SIL’s Q1 slide wasn’t fundamentally-justified.
For 20 quarters in a row now, soon after earnings seasons I’ve painstakingly analyzed the latest operating and financial results from the top 15 SIL component companies. These rarefied ranks include some of the biggest silver miners on the planet, and command fully 87.0% of SIL’s total weightings. While it takes a lot of time, effort, and expertise to digest these quarterly reports, the fundamental insights are well worth it.
This table summarizes the operational and financial highlights from the SIL top 15 during Q1’21. These major silver miners’ stock symbols aren’t all US listings, and are preceded by their rankings changes within SIL over the past year. The shuffling in their ETF weightings reflect changing market caps, which reveal both outperformers and underperformers since Q1’20. The symbols are followed by current SIL weightings.
Next comes these miners’ Q1’21 silver and gold production in ounces, along with their year-over-year changes from the comparable Q1’20. Output is the lifeblood of this industry, with investors generally prizing production growth above everything else. After that is a measure of silver miners’ relative purity, their percentage of quarterly sales actually derived from silver. Most silver miners also produce gold or base metals.
Generally the more silver-centric a miner, the more responsive its stock price is to changing silver prices. So traders looking for leveraged silver exposure via its miners’ stocks should stick to the purer producers. Then the costs of wresting that silver from the bowels of the earth are shown in per-ounce terms, both cash costs and all-in sustaining costs. The latter subtracted from silver prices help illuminate profitability.
That is followed by these miners’ hard quarterly revenues and earnings reported to securities regulators. Blank data fields mean companies hadn’t reported that particular data as of mid-May when Q1’s earnings season was winding down. And annual percentage changes are also excluded if they would prove misleading, like comparing two negative numbers or data shifting from positive to negative or vice versa.
With the average silver price in Q1’21 rocketing up 55.8% year-over-year to $26.18, the silver miners should have reported excellent results. They delivered for the most part, although their silver production continued to wane. For many years now, the major silver miners have been increasingly shifting their capital into gold mining. Primary silver miners are slowly going extinct since gold is more profitable to produce.
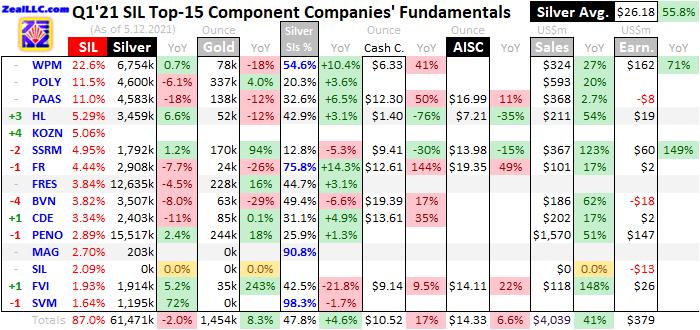
Overall the SIL-top-15 silver miners produced 61,471k ounces in Q1’21. That slumped a modest 2.0% YoY, which was the slowest rate of declining silver output since Q2’19. Out of those latest 20 quarters where I’ve been advancing this research thread, Q1’s SIL-top-15 production ranked near the bottom at 18th. The major silver miners’ collective output of their namesake metal continues to trend lower on balance.
The SIL top 15’s collective output peaked at 77,432k ounces way back in Q2’17. The last quarter where these major silver miners grew their silver production year-over-year was a slight positive blip in Q2’19. For the last seven quarters in a row, their silver mined has relentlessly shrunk. Relatively-pure silver deposits supporting primary silver mines are getting rarer, and they are challenging to operate profitably.
The best-available fundamental data on global silver supply and demand is published once a year by the venerable Silver Institute. The latest World Silver Survey covering 2020 was just released about a month ago. It revealed that only 27% of all the silver mined worldwide last year came from primary silver mines. Nearly 3/4ths of all the silver produced was merely the byproduct of lead/zinc, copper, and gold mines!
The major silver miners continued turning yellow last quarter, increasingly diversifying into gold with its superior economics. The SIL top 15’s total gold production surged 8.3% higher YoY to 1,454k ounces! That is on the higher side, ranking as 6th out of the last 20 quarters. Most of the production growth these major silver miners saw in Q1 came on the gold side. A couple traditional silver miners led that charge.
For decades SSR Mining was called Silver Standard Resources. While its silver production was flat last quarter, its gold output rocketed up 93.5% YoY to 170k ounces! That mostly resulted from SSRM acquiring the gold miner Alacer Gold last summer. Now this company operates three gold mines to just a single silver one. And that was an old mine winding down, although a new deposit nearby will extend its life.
Fortuna Silver, which is included in SIL under its Canadian symbol FVI, reported decent silver-production growth of 5.2% YoY. Yet its gold output soared a colossal 242.6% YoY to 35k ounces! This company is ramping up its new third mine which recently finished construction, a gold operation. Instead of buying or building more silver mines, SSR Mining and Fortuna Silver both chose to buy or build gold ones instead.
They certainly aren’t alone. First Majestic Silver, also under its Canadian FR listing in this leading silver-stock ETF, has long been the purest major silver miner in the world. But it just bought a company to acquire a gold mine which yielded 113k ounces last year. Once that deal is finished and that gold attributed to First Majestic, it too will overwhelmingly be a primary gold miner. The major silver miners are investing in gold.
After watching this ongoing shift away from the white metal for years now by its traditional major producers, every quarter I wonder if I should keep analyzing silver stocks. As primary gold miners, the larger ones are also included in the big gold-stock ETFs. As that Reddit-silver-short-squeeze episode proved, there is still plenty of investment demand for silver miners. But their leverage to silver wanes with their purity.
In Q1’21, the SIL top 15 averaged 47.8% of their quarterly sales coming from silver. This was mostly figured by multiplying silver production by silver’s average price, then dividing that by revenues. In some cases where companies didn’t report Q1 sales, they were approximated using gold and silver outputs and their average prices. Interestingly that relative silver purity was a considerable improvement, 4.6% better.
But a couple factors skewed it higher. First silver way outperformed gold in Q1 in average-price terms, as the white metal soared 55.8% YoY compared to the yellow one’s 13.4%. Thus silver’s contribution to total revenues surged. Maybe this silver-outperformance trend will continue, but it is unusual compared to recent-years precedent. Second, a long-time explorer MAG Silver is transitioning into a new silver miner.
It owns a minority stake in a big new silver mine under construction by silver behemoth Fresnillo. Even though that development ore only yielded 203k ounces of silver last quarter, that was 90.8% of MAG’s implied sales. Without that high purity read, the rest of the SIL top 15 averaged a much-lower 44.2% of their revenues from silver. That is more in line with preceding quarters’ trend of 43.7% and 44.0% purity.
Out of those 20 quarters I’ve been analyzing the SIL top 15’s latest results, only a single one clocked in over 50% in primary-silver-miner territory! The overall average was just 40.1% during that span. The lower the major silver miners’ silver purity falls, the less responsive their stock prices will be to silver’s action. Silver stocks’ leverage to silver continuing to wane will likely erode investors’ interest in this sector.
Silver-mining production trends are usually inversely proportional to unit mining costs, lower outputs lead to higher costs. That’s because silver mines’ operating costs are largely fixed. They can only process so much silver-bearing ore each quarter, which requires about the same levels of infrastructure, equipment, and employees. So less silver run through their fixed-capacity mills leaves fewer ounces to spread costs across.
Cash costs are the classic measure of silver-mining costs, including all cash expenses necessary to mine each ounce of silver. But they are misleading as a true cost measure, excluding the big capital needed to explore for silver deposits and build mines. So cash costs are best viewed as survivability acid-test levels for the major silver miners. They illuminate the minimum silver prices necessary to keep the mines running.
The SIL top 15’s average cash costs blasted 16.8% higher YoY to $10.52 per ounce in Q1’21. That was way faster than waning output would imply, and the highest cash costs by far in the last 20 quarters. That dwarfed the previous record high of $9.01 in Q1’20. But this sector cost read was skewed high by Peru’s perpetually-struggling Buenaventura. Excluding its extreme outlying $19.39, that average retreats to $9.26.
All-in sustaining costs are far superior than cash costs, and were introduced by the World Gold Council in June 2013. They add on to cash costs everything else that is necessary to maintain and replenish silver-mining operations at current output tempos. AISCs give a much-better understanding of what it really costs to maintain silver mines as ongoing concerns, and reveal the major silver miners’ true operating profitability.
These major silver miners’ AISCs climbed 6.6% YoY to an average of $14.33 per ounce in Q1’21. That was still well under the peak of $15.36 in Q3’18, and was skewed higher by First Majestic Silver. It reported $19.35 AISCs, which were blamed on lower production to spread fixed costs across. The SIL top 15’s average AISCs are generally volatile though, as the sample size of companies reporting them is small.
But with major silver miners morphing into gold producers, we have to take whatever data we can get. At last quarter’s high average $26.18 silver prices, $14.33 AISCs are still very profitable. That implies these elite silver miners as an industry were earning $11.85 per ounce, which is the second-highest in the last 20 quarters after Q3’20’s $14.77. This profitability proxy skyrocketed 253.4% higher YoY from Q1’20’s $3.35!
That furthers a five-consecutive-quarter trend where the major silver miners’ implied earnings climbed at impressive double-digit rates. That streak achieved 18.2%, 23.1%, 137.2%, 65.6%, and 253.4% YoY growth in quarterly average silver prices less SIL-top-15 average all-in sustaining costs! And those big numbers will continue in the current Q2, as silver was averaging a strong $26.12 quarter-to-date in mid-May.
That was in line with Q1’s high prevailing prices, which will lead to more big unit profits. While the major silver miners’ AISCs are something of a crapshoot since so few are reported, over the last four quarters they averaged $12.62. If Q2’21’s come in anywhere close to that, the SIL top 15 will enjoy huge earnings growth for another quarter. The comparable earnings proxy a year earlier in Q2’20 was just $4.15 per ounce.
The SIL top 15’s hard financial results reported to their securities regulators under Generally Accepted Accounting Principles or other countries’ equivalents confirmed their strong performances last quarter. These major silver miners’ collective revenues soared 40.8% YoY to $4,039m. That was the second-highest seen in the last 20 quarters, only trailing Q4’20’s $5,044m. Higher silver and gold prices are a big boon.
The major silver miners’ actual total bottom-line accounting earnings were good too, improving radically from the comparable quarter. The SIL top 15 reporting those numbers by mid-May had total profits of $379m. That was on the higher side of recent years’ precedent, and a colossal improvement from the $274m loss these companies suffered in Q1’20. Their increasing focus on gold is likely a major driver of this.
Better precious-metals prices also really boosted operating cash flows generated by the SIL top 15. In Q1’21 they blasted up 33.2% YoY to $687m. That fed into the silver miners’ cash treasuries soaring 45.9% YoY to $3,968m. Operations spinning off so much cash will certainly drive more buying of mines and entire companies. Based on recent-years precedent though, most acquisitions will likely be gold-centric.
So the dwindling major silver miners are faring well, as they certainly should be with such high prevailing metals prices. Their latest quarterly results were strong in some ways, but lackluster in others. Looking at this table, it is surprising how many of the SIL top 15 reported lower silver and/or gold output compared to Q1’20. That should’ve been an easy comp, as the COVID-19 lockdowns were starting late in that quarter.
While we own a few of these better major silver miners in our trading books, it is hard to get excited about this sector. The long-time traditional major silver miners are increasingly primary gold miners, giving their stocks more affinity to the yellow metal than the white one. Maybe that doesn’t matter, as silver’s primary driver is gold’s fortunes. But it is getting more challenging to find pure silver-stock exposure for portfolios.
The SIL ETF itself remains problematic too. Without many major silver miners to pick from, there’s not a lot of options for this ETF’s managers. Yet some of SIL’s bigger positions are confounding. Russia’s Polymetal was this ETF’s second-largest holding at 11.5% in mid-May. Yet silver accounted for just 20.3% of its sales last quarter. And that’s high for this company, as POLY’s silver purity ran just 13.6% in Q4’20.
And Korea Zinc at 5.1% should be booted from this silver-stock ETF posthaste. It is a large base-metals smelter that has nothing to do with mining silver! While it does smelt silver, that is still a relatively-small fraction of its business. Global X named their ETF the “Silver Miners ETF”, so having a non-miner like Korea Zinc in it with a high weighting really hurts its credibility. SIL is really another gold miners’ ETF in disguise.
So despite excellent silver prices, silver-stock investing is a lot harder than it used to be. The major silver miners are pouring most of their growth capital into boosting their gold outputs. The opportunity costs for that are much less allocated to adding more silver production. The more gold traditional silver miners sell, the less silver drives their revenues. That leaves their stock prices much less sensitive to silver action.
Straddling gold’s extended-correction bottom in recent months, we gradually filled up the trading books of our newsletters with fundamentally-superior precious-metals miners. But for the major silver miners that made that cut, I was more excited about their surging gold production from mine expansions, builds, and buys than their silver output. Silver is increasingly a byproduct even in this realm, fueling apathy among traders.
The bottom line is the major silver miners of the leading silver-stock ETF generally reported good results in Q1. Continuing their years-old diversification trend, their silver production waned as their gold output surged. This ongoing shift continued to dilute the purity of the traditional silver miners, leaving their stock prices more dependent on gold than silver. While more profitable, these silver stocks trade more like gold stocks.
The high prevailing silver prices did help drive big year-over-year surges in revenues, earnings, operating cash flows generated, and cash treasuries. Those good fundamentals should attract capital, especially as silver powers higher with gold. As that Reddit-silver-short-squeeze episode showed, traders still flock back to major silver miners when silver runs. While that lasts, these stocks should still amplify silver’s gains.
At Zeal we walk the contrarian walk, buying low when few others are willing before later selling high when few others can. We overcome popular greed and fear by diligently studying market cycles. We trade on time-tested indicators derived from technical, sentimental, and fundamental research. That has already led to unrealized gains in this current young upleg as high as +64.9% on our recent newsletter stock trades!
To multiply your wealth trading high-potential gold stocks, you need to stay informed about what’s going on in this sector. Staying subscribed to our popular and affordable weekly and monthly newsletters is a great way. They draw on my vast experience, knowledge, wisdom, and ongoing research to explain what’s going on in the markets, why, and how to trade them with specific stocks. Subscribe today while this gold-stock upleg remains young! Our newly-reformatted newsletters have expanded individual-stock analysis.
Adam Hamilton, CPA
Copyright 2000 - 2021 Zeal LLC (www.ZealLLC.com)
********
More from Silver Phoenix 500


