Silver Miners’ Q4’20 Fundamentals


The silver miners’ stocks have mostly consolidated high over the past half-year or so, mirroring resilient price action in the metal they produce. But this relative strength has been overshadowed by the extended correction in gold, which forced gold stocks lower. The resulting bearish sentiment engulfed silver stocks, leaving them out of favor. But their recently-reported Q4’20 results reveal they are fundamentally-strong.
There aren’t many major silver miners in the world, and only a handful are primary silver producers that derive over half their revenues from silver. With such a small population, there are only a few silver-stock ETFs. The leading and dominant one is the SIL Global X Silver Miners ETF, which is this tiny sector’s best benchmark. But nearing the end of Q4’20’s earnings season in mid-March, it only held $1.2b in net assets.
SIL’s super-volatile price action since early 2020 reflects the wild ride this sector has seen. A bit over a year ago, the silver stocks got sucked into the broader stock panic fueled by government-lockdown fears. In just a few weeks into mid-March, SIL plummeted 43.8%! The major silver miners were following silver, which cratered a brutal 35.2% over a slightly-longer span. And silver in turn was amplifying gold’s panic plunge.
But just as traders assumed this sector was doomed, the precious metals reversed hard to soar into huge post-panic uplegs. Over the next 4.8 months into early August, SIL skyrocketed 176.9% higher! That was far better than the +134.1% clocked in by GDX, the leading gold miners’ ETF. Normally silver stocks do follow gold stocks, as gold’s fortunes are silver’s primary driver. Thus silver stocks are usually slaved to gold.
Indeed SIL corrected with the gold stocks into late November, retreating 23.5% over 3.6 months. But the silver miners have proven far more resilient since, well outperforming the gold miners. Into early January with silver handily besting gold, SIL surged 26.2% in 1.4 months. And unlike gold stocks which suffered a failed correction-low retest in late February and early March, SIL’s original late-November low has mostly held.
The main reason was outsized silver strength in late January fueled by speculation Reddit’s famous wallstreetbets’ traders would attempt to force a silver short squeeze. Thus unlike gold stocks which have ground lower on balance since their last bull upleg peaked in early August, the silver stocks have been consolidating high. Do their latest Q4’20 operational and financial fundamentals support such outperformance?
For 19 quarters in a row now, I’ve painstakingly analyzed the major silver miners’ latest quarterly results soon after they are reported. While SIL contained a crazy 42 component stocks in mid-March, I’m limiting my analysis to its top 15 holdings. These are the world’s biggest and best silver miners, which command a dominant 87.9% of SIL’s total weighting. The lion’s share of capital chasing silver stocks ends up in them.
Unfortunately Q4 results closing out calendar years arrive much later than normal quarterlies. Since the annual reports containing Q4 numbers are bigger, more complex, and must be audited by independent CPAs, securities regulators grant extended filing deadlines. Those are 60 days after year-ends in the US, and a ridiculous 90 days in Canada where many of the world’s silver stocks trade! So Q4 analysis runs later.
Some Canadian silver miners rather disrespectfully force their shareholders to wait three full months for Q4 results, after Q1 is nearly finished! The major silver miners trade in the US, UK, Mexico, and Canada, which makes amassing this data somewhat challenging. There are different financial-reporting requirements around the globe, and even within the same country miners report different data in different ways.
Some annual reports are well-laid-out and easy to parse, while others seem intentionally opaque requiring lots of digging and calculations to tease out comparable data. The United Kingdom requires half-year reporting instead of quarterly, although its silver miners usually still give supplemental quarterly updates. But in cases where six-month data was all that was available, it is split in half to approximate Q4’20 results.
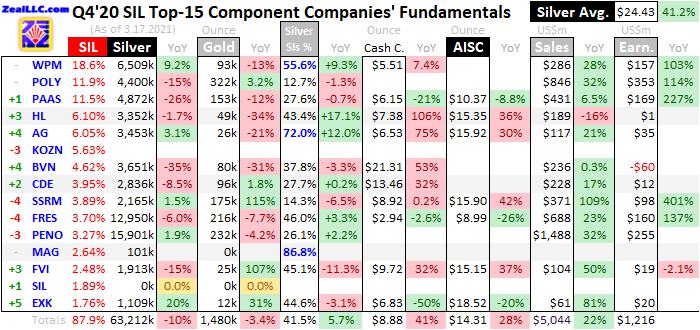
This table summarizes the operational and financial highlights from the SIL top 15 in Q4’20. These elite silver miners’ symbols are listed, some of which are from their primary foreign stock exchanges. That is preceded by their ranking changes in terms of SIL weightings from Q4’19. Then their current weightings as of mid-March follow those stock symbols. This ETF generally weights silver stocks by market capitalizations.
Next each company’s quarterly silver and gold production in ounces is shown, followed by their year-over-year changes from Q4’19. Their silver output can be used to gauge relative silver purity. The higher miners’ percentage of quarterly revenues derived from silver production, the more responsive their stock prices are to silver price action. Traders buy silver stocks because they want leveraged exposure to silver.
So the next column reveals how silver-centric miners actually were last quarter. It is mostly calculated by multiplying companies’ quarterly silver outputs by silver’s average price in Q4, then dividing those results by quarterly revenues. When sales aren’t reported, this ratio can be approximated by dividing implied silver revenues by implied gold-plus-silver sales. But that isn’t optimal since it excludes base-metals byproducts.
The rare primary silver miners’ silver-purity percentages are highlighted in blue. Their stock prices usually show superior leverage to silver compared to their lower-purity peers. That is followed by cash costs and all-in sustaining costs per ounce, along with their year-over-year changes. They reveal how much it costs the SIL-top-15 silver miners to blast their metal loose from the earth and process it, on a comparable unit basis.
Next quarterly revenues and hard GAAP earnings are shown, along with their YoY changes. Blank data fields mean companies hadn’t reported that particular data as of this essay’s mid-March cutoff nearing the end of Q4’s earnings season. Blank percentage fields indicate those changes would be either misleading or not meaningful, like comparing two negative numbers or data shifting from positive to negative and vice versa.
Thanks to quarterly average silver prices rocketing up 41.2% YoY to $24.43 in Q4’20, major silver miners ought to have reported awesome results last quarter. But disappointingly they came in mixed instead, strong financially yet weaker operationally. While silver miners certainly aren’t struggling with such high prevailing silver prices, their overall silver production continues to wane in favor of way-more-profitable gold.
For the years I’ve been advancing this silver-stock-quarterly-fundamentals thread, the overarching theme has definitely been silver miners actively diversifying into gold. That still hasn’t changed despite the last two quarters enjoying excellent high average silver prices. For many years now, gold has simply proven much more lucrative to mine than silver. So silver-company managements have invested in more gold output.
The SIL-top-15 major silver miners collectively produced 63,212k ounces of their white metal in Q4’20, which was down a major 10.0% YoY! And that was much farther under the 77,432k high-water mark in the last 19 quarters, which was achieved way back in Q2’17. These elite silver miners’ output of their traditional metal has been trending lower on balance for years now, because of gold’s superior economics.
The SIL top 15’s gold production weighed in at 1,480k ounces last quarter, which also slumped from Q4’19’s levels. But that was only down 3.4% YoY, much less than silver’s output plunge. Governments’ COVID-19 lockdowns certainly contributed to less silver and gold mined. Some of the longest economic shutdowns came in Mexico and Peru, the world’s top-two silver-producing countries hosting many larger mines.
Many silver-mining operations run by these SIL-top-15 miners were ordered shuttered back in late Q1 and early Q2. Most of those mines remained close until late Q2 or early Q3. Even after those lockdowns were lifted, it takes time to ramp mine throughput back to full-speed. Those slow processes ran into Q4 for some silver mines, which contributed to last quarter’s overall decline in major silver miners’ production.
And necessary COVID-19 mitigation measures remaining in place left mining operations less efficient and more expensive. A quarterly report I read from an unrelated gold miner blamed rising production costs partially on “the inherent inefficiencies of social distancing in underground operations”. But despite these big challenges, the major silver miners have still rapidly bounced back from the worst of the lockdown orders.
In Q4’20, the SIL top 15’s total silver and gold output had already rebounded a sharp 17.2% and 22.7% from their deep pandemic nadirs in Q2’20. That production recovery should continue. In the four quarters ending in Q1’20 before the pandemic slammed silver mining, these major miners averaged quarterly silver production of 69,275k ounces. Gold has already recovered to that same-period mean of 1,482k ounces!
The composition changes among the SIL top 15 also skewed their silver and gold output lower in Q4’20. A year earlier in Q4’19, producers Hochschild Mining and Silvercorp Metals ranked 13th and 14th. But they drooped to 17th and 16th in mid-March, partially displaced by SilverCrest Metals which is an explorer with no production. Removing HOC and SVM output from the year-earlier quarter makes them more comparable.
Adjusted for this ranking change alone, the SIL top 15’s silver production only retreated a far-milder 2.4% YoY. And their gold output actually grew 0.8%. That makes last quarter’s production declines look much less problematic. But individual major silver miners were still struggling, with a majority of the SIL top 15 seeing significant-to-serious declines in their own silver and/or gold outputs in Q4’20 compared to Q4’19.
Interestingly these major silver miners’ overall purity still improved considerably last quarter even with their silver production lagging gold. The SIL top 15 averaged 41.5% of their Q4’20 revenues from silver, the best in five quarters and way better than Q4’19’s 35.8%. That leaves these companies’ stock prices more responsive to silver, helping explain why they’ve generally outperformed their gold-stock peers recently.
Three primary silver miners greatly contributed, with Wheaton Precious Metals, First Majestic Silver, and MAG Silver deriving 55.6%, 72.0%, and 86.8% of their Q4 sales from silver! That makes them the only primary silver miners in SIL’s larger holdings, generating over half their revenues from it. MAG dragged the overall average higher, but its new silver mine is only slowly spinning up months away from commercial.
A bigger factor in this improving silver purity is the white metal’s outperformance of the yellow one in Q4. Last quarter’s average silver price soared 41.2% YoY to $24.43, much better than gold’s still-impressive 26.5%-YoY surge to a $1,876 average price. The major miners would have to see silver’s gains outpace gold’s for years before their investment focus would swing substantially back from gold to silver again.
In silver mining, output levels and unit costs are usually inversely proportional. The more silver mined, the more ounces to spread this industry’s big fixed costs across. Those are generally determined when mines are being planned, then don’t change much. Quarter after quarter, individual mines require about the same levels of infrastructure, equipment, and employees to feed their fixed-capacity mills with ores to process.
Those fixed costs staying roughly steady regardless of prevailing silver prices is what gives silver miners’ earnings big leverage to the white metal. With overall SIL-top-15 silver output coming in about 10% lower last quarter, these silver miners’ unit costs should’ve risen proportionally. But unfortunately they proved far worse on average, surging dramatically on soaring costs from the miners suffering larger output drops.
Cash costs are the classic measure of silver-mining costs, including all cash expenses necessary to mine each ounce of silver. But they are misleading as a true cost measure, excluding the big capital needed to explore for silver deposits and build mines. So cash costs are best viewed as survivability acid-test levels for the major silver miners. They illuminate the minimum silver prices necessary to keep the mines running.
The SIL top 15’s cash costs soared 41.0% higher in Q4’20 to $8.88 per ounce! That proved the highest by far in the 19 quarters I’ve been doing this research. Nevertheless, this isn’t troubling since these are still way below prevailing silver prices. These lofty cash costs are skewed abnormally high as well. One reason is Peru’s perpetually-struggling Buenaventura reporting absurd $21.31 cash costs last quarter!
BVN’s silver output collapsed 34.7% YoY in Q4, the worst among these major silver miners. With way fewer ounces to bear big fixed costs, they soared on a unit basis. Excluding this extreme anomaly, the rest of the SIL top 15 averaged much-more-reasonable $7.49 cash costs. Coeur Mining’s also came in really high. CDE’s costs are so excessive that it stopped reporting all-in sustaining costs entirely to hide them!
Finally the SIL top 15’s average costs change considerably based on how Chinese silver miner Silvercorp Metals ranks. After applying credits from its massive lead and zinc byproducts to silver output, SVM’s unit silver costs are very low or even negative. This company ranked as 14th in SIL a year ago, but slipped to 16th for Q4’20. Had SVM been in the top 15, its -$2.76 cash costs would’ve sunk the overall average to $7.82.
All-in sustaining costs are far superior than cash costs, and were introduced by the World Gold Council in June 2013. They add on to cash costs everything else that is necessary to maintain and replenish silver-mining operations at current output tempos. AISCs give a much-better understanding of what it really costs to maintain silver mines as ongoing concerns, and reveal the major silver miners’ true operating profitability.
Last quarter’s AISCs reported by the SIL top 15 averaged $14.31 per ounce, which also surged 27.9% YoY. But these still weren’t excessive like cash costs, well below the 19-quarter peak of $15.36 seen in Q3’18. Buenaventura didn’t distort them, because it is a primary gold miner only reporting AISCs on its gold operations. And had Silvercorp’s $6.92 AISCs made the top 15, this average would’ve run lower at $13.39.
The major silver miners’ average all-in sustaining costs can also be subtracted from average silver prices for a great proxy of industry earnings trends. Silver again averaged $24.43 last quarter, which proved the highest in the last 19 quarters edging out Q3’20’s $24.39. That less the SIL top 15’s average AISCs of $14.31 yields hefty $10.12 unit profits for the major silver miners! That’s the second-highest since at least Q2’16.
Only the prior quarter’s $14.77 was better, fueled by anomalously-low $9.62 AISCs among the SIL top 15 then. But Q4’20’s $10.12 still rocketed up 65.6% year-over-year! Such explosive sector earnings growth has to be among the best in the entire stock markets. That argues that much-higher silver-stock prices are fundamentally-justified, even with declining output. This awesome outsized profits growth should continue.
Silver has proven very resilient in Q1’21, mostly shrugging off gold’s vexing extended correction. So as of mid-March, silver was averaging a fantastic $26.38 quarter-to-date in Q1. That is another 8.0% higher quarter-on-quarter from Q4’20, and up a magnificent 57.0% YoY! If the SIL top 15’s Q1’21 AISCs come in around their last four quarters’ $12.40 average, sector per-ounce profits could skyrocket 317% YoY to $13.98!
With silver prices so high relative to recent years, the major silver miners are going to report fat profits in Q1 regardless of where their all-in sustaining costs shake out. So silver stocks have great potential to surge dramatically higher around their upcoming Q1 earnings season, which will run from mid-April to mid-May. That coincides with gold stocks’ big seasonal spring rally, which should amplify silver stocks’ upside.
The major silver miners’ strong fundamentals last quarter were confirmed in their hard accounting results reported to national securities regulators. These conservative numbers are based on Generally Accepted Accounting Principles in the US or their equivalents in other countries. Despite lower production, the SIL top 15 reported blowout financial results last quarter! Silver-stock prices certainly aren’t reflecting those yet.
These elite silver miners totaled $5,044m in revenues in Q4’20, the best sales by far in the 19 quarters I’ve been analyzing the SIL top 15’s results! That surged 22.1% YoY, with the much-higher average silver and gold prices more than offsetting waning output. With that 41.5% silver purity among these silver miners, they are really mostly primary gold miners. So better gold prices help more than better silver ones.
Those strong quarterly revenues for the SIL top 15 yielded outstanding hard GAAP profits of $1,216m in Q4’20, fantastically better than Q4’19’s $3m! Those were the highest accounting earnings by far in the last 19 quarters, dwarfing the previous high of $455m. Bigger profits give silver miners much more capital to grow their outputs, fueling a virtuous circle of production and earnings growth greatly boosting stock prices.
Stronger earnings also lower valuations, making silver miners look more attractive fundamentally to big institutional investors. That generally wasn’t reflected in trailing-twelve-month price-to-earnings ratios yet, as the SIL top 15’s profits were weak over this past year around those COVID-19 lockdowns. But after the likely-blowout results from Q1’21, the major silver miners’ valuations ought to plunge dramatically lower.
The high silver and gold prices last quarter drove massive operating-cash-flow generation of $1,924m among the SIL top 15, soaring 76.4% YoY. That too was a record high within the last 19 quarters. That helped these elite silver miners’ cash treasuries also rocket 89.6% higher YoY to $5,271m at the end of Q4’20. Those rich cash hoards will finance output growth, through mine expansions, builds, and acquisitions.
So despite lower silver and gold output, the major silver miners’ fundamentals proved incredibly strong in their recently-reported Q4’20 results. That supports and justifies much-higher silver-stock price levels in coming months, as silver continues powering higher on balance with gold’s next bull upleg. And silver’s parallel bull has great potential to grow much larger in coming years, as this metal is nowhere near highs.
Back in Q2’11, silver rocketed parabolic in one of its periodic speculative manias. It peaked over $48 per ounce, and silver averaged $38.33 in that quarter. Today there is vastly more money in the system to chase silver once it regains favor among speculators and investors. The Fed’s balance sheet alone has ballooned 2.86x since then! So today’s silver bull has excellent potential to ultimately soar way higher.
The bottom line is the major silver miners just achieved some of their best financial results ever in Q4, despite waning production. Their revenues, earnings, and operating cash flows soared to at-least-19-quarter record highs on better prevailing silver and gold prices. And that massive profits growth is likely to accelerate even more in Q1, with silver continuing to grind higher on balance despite gold’s extended correction.
That will force valuations dramatically lower, leaving this sector more attractive to mainstream institutional investors. And silver and silver stocks will increasingly return to favor as the next bull uplegs in gold and gold stocks grow. So this silver realm will likely see major capital inflows in coming months, catapulting silver-stock prices much higher. Big coming gains are totally justified given silver miners’ strong fundamentals.
At Zeal we walk the contrarian walk, buying low when few others are willing before later selling high when few others can. We overcome popular greed and fear by diligently studying market cycles. We trade on time-tested indicators derived from technical, sentimental, and fundamental research. That’s why all 1178 stock trades recommended in our newsletters since 2001 averaged hefty +24.0% annualized realized gains!
To multiply your wealth trading high-potential gold and silver stocks, you need to stay informed about what’s going on in this sector. Staying subscribed to our popular and affordable weekly and monthly newsletters is a great way. They draw on my vast experience, knowledge, wisdom, and ongoing research to explain what’s going on in the markets, why, and how to trade them with specific stocks. Subscribe today and take advantage of our 20%-off sale! Early in a young gold-stock upleg is a great time to get deployed.
Adam Hamilton, CPA
Copyright 2000 - 2021 Zeal LLC (www.ZealLLC.com)
*********
More from Silver Phoenix 500


