Silver Price Forecast: The Coming Surge Will Fail


Silver has been the laggard of the precious metals sector as of late: while gold has just broken above its 2016 high of $1,378 on the heels of trade war tensions and the possibility that the Federal Reserve may lower interest rates this year, silver has barely budged.
Year-to-date, silver is down 3.5% to $15.00 per troy ounce as of the end of the week. Meanwhile, gold is higher by 9.3% or $119 for the year, to $1,400.
What are we to make of this continued underperformance by silver? Is it a sign that the move in gold is suspect and should not be trusted? Or is it a sign that we are simply in the early stages of a new bull market?
Let us examine the present period in silver prices, the modern history of the gold to silver ratio, and what this might mean for silver investors going forward.
A Silver Rally Ahead – But Sustainable?
Our model shows that a significant rally is setting up for silver prices over the next 6 – 18 months. However, we expect this rally to fade, and that prices will drift lower again into the early 2020’s. Investors should prepare to capture what could be a spectacular move over the coming year, yet then look to exit silver positions prior to a major decline which should take prices back below $15 into the 2020’s.
This will be a challenging period ahead for silver investors – as both the surges higher and declines lower should be accompanied by volatile emotions of euphoria followed by despair.
However, a proper lens will allow investors to remain calculated and prudent just as things are heating up. Let us observe.
Evaluating Silver Prices
We could evaluate the silver market in a dozen different ways.
For example, we might ask: how much supply is coming from silver mines per year? [Answer: 855.7 million ounces, as of 2018.]
Meanwhile, how much do precious metals investors demand in physical coins or bars each year? [Answer: 181.2 million ounces, as of 2018.]
Where does the rest of the silver supply go? [Answer: mostly to industrial fabrication, including electronics and solar panels.]
All that is fine for conversation starters. Yet what ultimately matters most to silver investors?
Answer: the price – and which direction the price is expected to move.
So – we will now evaluate price, as price contains the sum of all the buyers and all the sellers that appear in the market. If there is one thing that matters more than any fundamental data point, it is the price.
Silver Price Analysis
What does the silver price trajectory have to tell us?
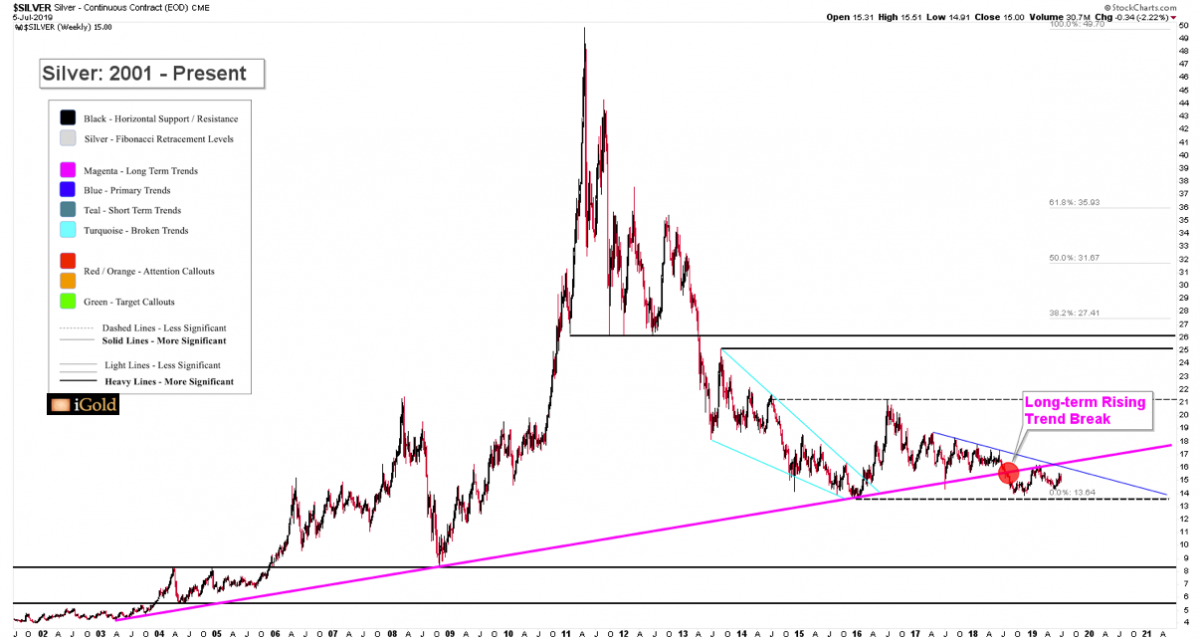
First, note that in 2018 silver broke lower from a major long-term rising trend. Below we see the multi-decade rising trend which began in the year 2003 (magenta color). This trend was broken last year (red callout) when silver fell below $15.70 per ounce.
Since that breakdown, silver has been unable to recapture the rising trend. Something has clearly changed with the silver price, compared to the trajectory of the previous 15 years.
Gold to Silver Ratio
Let us now turn to examine the gold to silver ratio. Stated otherwise, this ratio shows the number of ounces of silver required to purchase one ounce of gold.
Below we show a three-part chart since 2002:
- Top – the gold to silver ratio.
- Middle – the price of gold.
- Bottom – the price of silver.
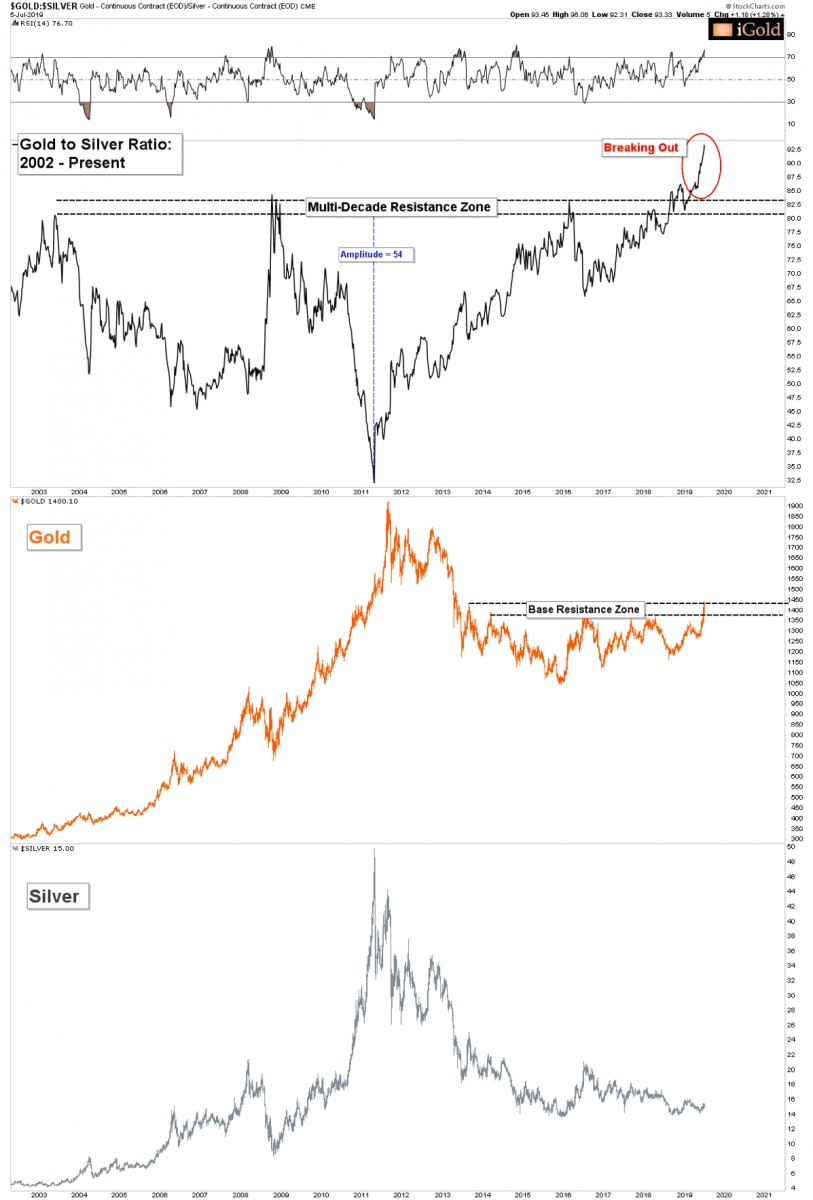
Note that on top, the gold to silver ratio is breaking upward (red callout) above a multi-decade resistance zone between 80 – 84 (black), dating back to the early-2000’s.
The amplitude of the consolidation leading up to the breakout was 54 (blue). Thus, the target for the unfolding advance in the gold to silver ratio equals 138 (54 amplitude + 84 upper resistance level = 138 target).
In other words, this projection calculates that silver is eventually going to fall to its lowest value relative to gold in modern history.
First a Surge
However, we strongly expect that a significant rally is due first in silver. This surge will offer major opportunities for bullion and silver mining investors to profit over the next 6 – 18 months.
Yet it is suggested that investors consider exiting at least a portion of their silver positions during the coming surge, as the rally is expected to be isolated in nature and not part of a larger bull market (yet).
Gold to Silver Ratio Warning
Are there examples from history which show an advancing gold price, a lagging silver price, and a breakout in the gold to silver ratio – similar to what we are seeing now?
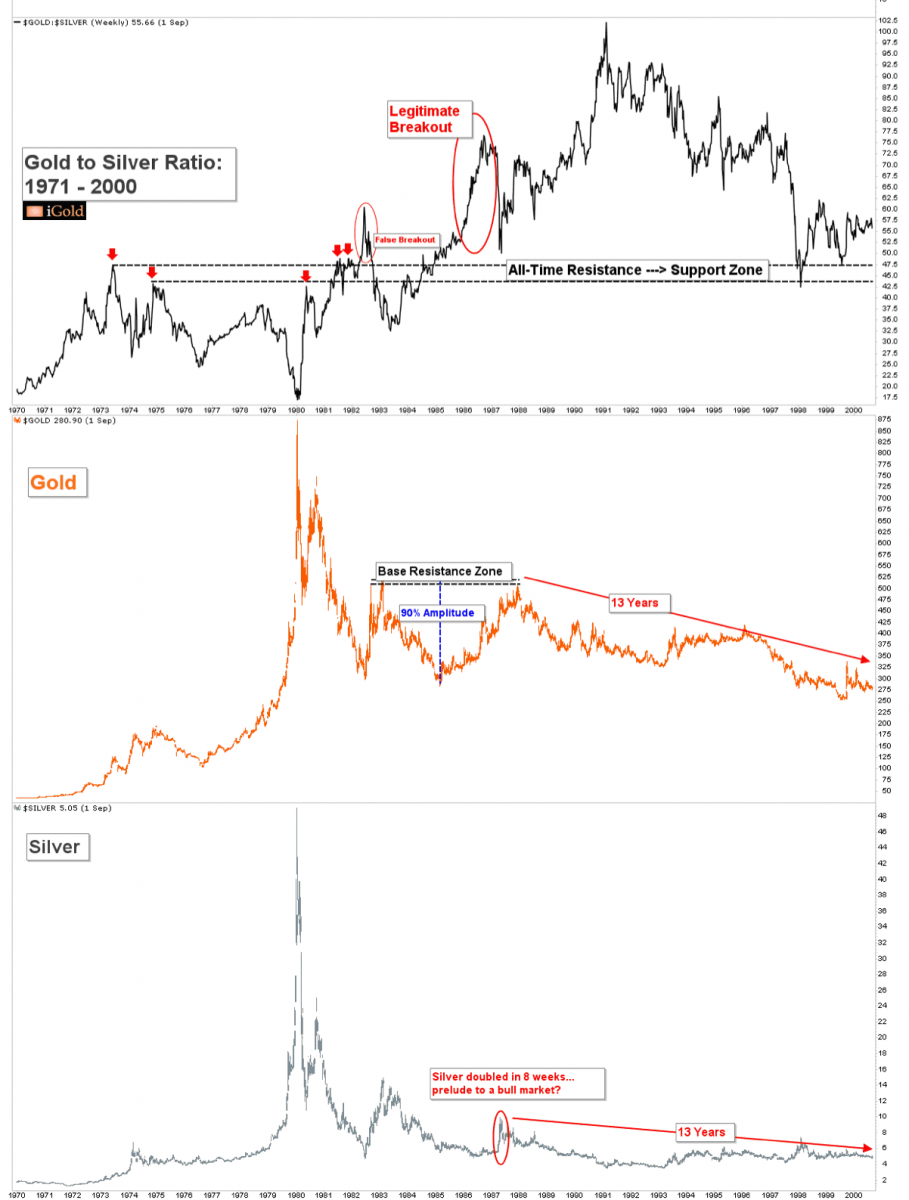
Yes: consider the example from the mid-1980’s, when as gold recovered from $275 per ounce back up to $520, silver mostly ignored the advance, and thus the gold to silver ratio broke upward during gold’s climb.
A surging gold to silver ratio as gold is advancing is a major warning sign that the entirety of the precious metals sector is not receiving capital inflows. In other words, silver is being ignored. In such circumstances, rallies tend to be not sustained.
Note that in 1987, as gold approached its $520 resistance level (black), the gold to silver ratio was breaking upward (red callout). This is exactly the same scenario as is occurring today, as the gold to silver ratio is breaking out as gold approaches its $1,430 resistance level (compare with chart, above).
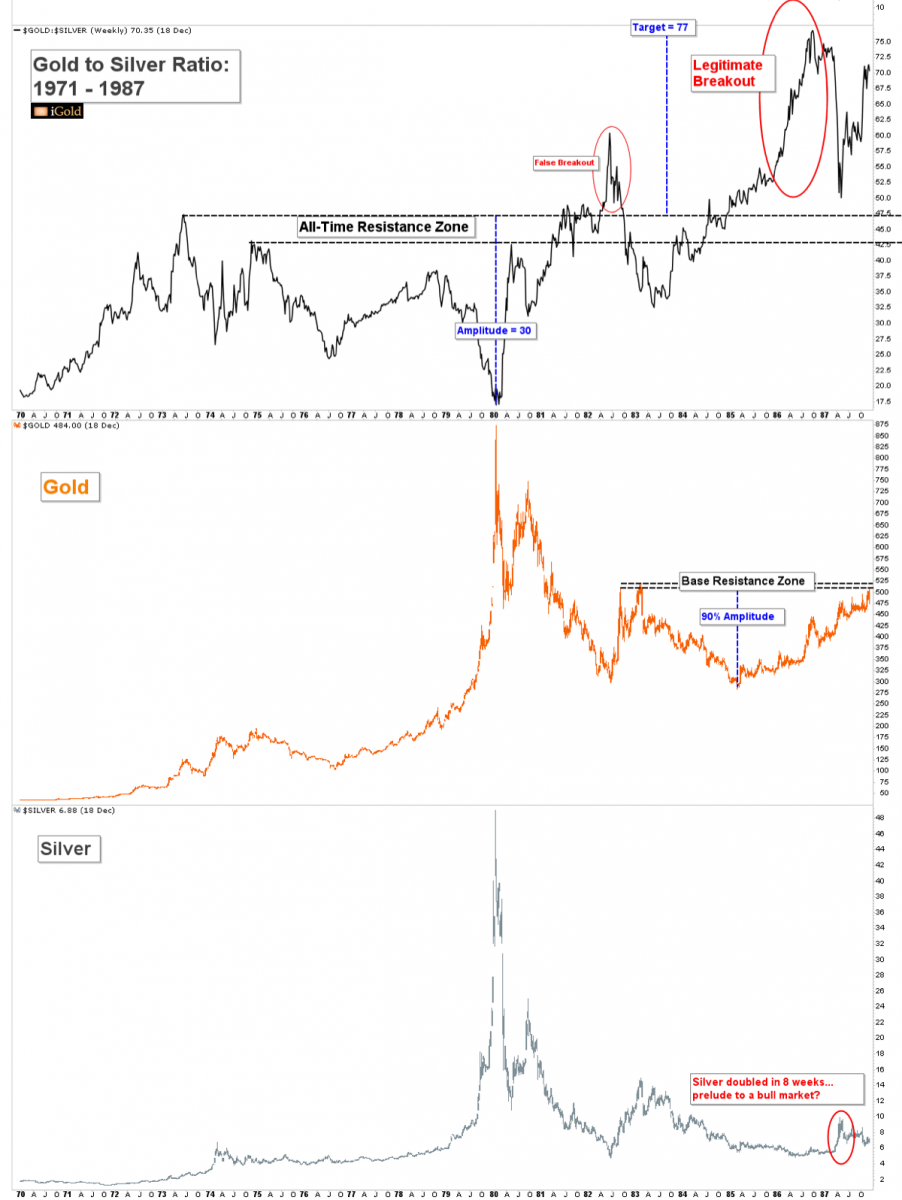
100% Silver Surge – Sign of a Bull Market?
Note that in the terminal stages of gold’s advance back toward its $520 resistance, silver had a major surge from near $5 per ounce to just below $10 in April 1987 (bottom of chart, red callout, above). This was a massive near-100% surge in silver in just eight short weeks.
Can we imagine a similar surge in today’s prices? Such would equate to silver doubling from $15 to $30 in two months.
Who following the silver market amidst a doubling in eight weeks would not proclaim the advance to be a sure sign of a new bull market in the making? Indeed, it would be hard to fathom anything else.
But was the doubling in silver from $5 to $10 in 1987 as the gold to silver ratio broke upward the start of a bull market?
Let us extend the three-part chart above from 1987 out to the year 2000. Note that the near 100% surge in silver was actually a fleeting rally, and silver prices drifted lower for an astonishing 13 years further, fully giving back all gains.
Those who anticipated the short-term rally made out with small fortunes. But those who chased the rally and expected it to be part of a new bull market had decades of pain ahead of themselves:
Key Takeaways from the 1987 Example
The 1987 example shows us that an advancing gold price amidst a gold to silver ratio which is breaking upward should not be trusted.
At no point in the freely traded history of these metals has an advancing gold price amidst a breakout in the gold to silver ratio signified the start of a legitimate bull market.
Presently in 2019, gold is again rallying, with the gold to silver ratio again breaking a multi-decade resistance zone.
Could this be the first time in history that this signal leads to a sustained precious metals advance?
Perhaps – but let us not ignore the words of the legendary investor John Templeton, who warned us to never assume that “this time it’s different.”

Capturing the Silver Surge
Prudent investors will apply the knowledge that markets move in repeating waves and patterns to the present cycle.
We anticipate that as gold moves higher toward the $1,400’s and $1,500’s over the next year, silver will continue to lag.
The gold to silver ratio will thus continue breaking upward, exceeding 100, shocking most investors.
Yet then – almost without warning – silver will see a surge similar to the 1987 example when it advanced nearly 100% in 8 weeks. While we cannot yet predict the exact price level, we should expect to see silver advance from present prices to between $21 and $25, with the possibility of an overshoot to $30, within a short timeframe.
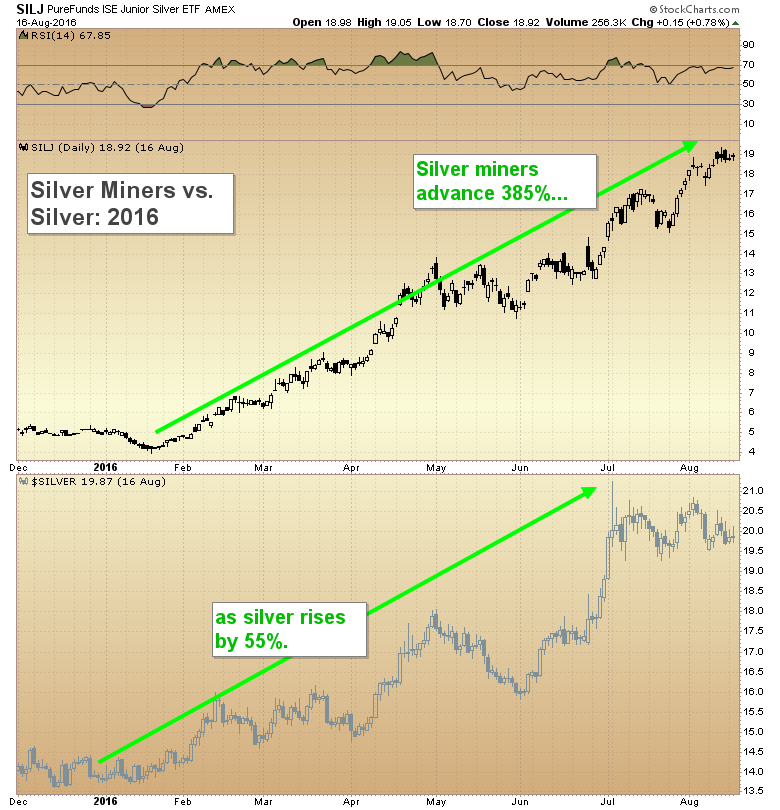
We are preparing now to capture this move in silver over the coming 6 – 18 months. Silver mining companies advanced on average 385% during the 2016 surge, as silver bullion itself advanced 55%.
Yet investors must keep alert – for profits in the coming silver surge should be taken when they are available. This will not be the time to hold silver indefinitely. Those who take profits in the coming surge, and who then step back and wait for the decline to unfold, will have plentiful capital ready to capture the final bottom in silver when the commodity finally bottoms in the 2020’s…
Takeaway on Silver Prices
Our analysis shows that silver is preparing for a major surge over the next 6 – 18 months, which will allow it to partially catch up with gold’s advance.
However, the major red flag is that the gold to silver ratio is breaking upward from a multi-decade resistance zone, just as it did in 1987, as gold climbs.
Throughout history, when the ratio breaks upward as gold advances, this serves as a warning that the metals advance is unsustainable.
Let us prepare to capture this move in silver bullion and mining companies. Yet let us not expect the start of a new bull market – yet.
Those who understand the warning signals from history may be the few fortunate enough to preserve capital for the next major precious metals bottom, when it arrives in the 2020’s.
*********

Christopher Aaron began his career as an intelligence analyst for the CIA and Department of Defense. He served two tours to Afghanistan and Iraq between 2006 - 2009, conducting pattern-of-life mapping for military leaders.
Mapping shares similarities with technical analysis of the financial markets because both involve the interpretation of repeating patterns found in human nature. He is the founder of iGold Advisor, providing independent research and analytics on all aspects of the precious metals markets.
He speaks regularly on the cyclical patterns found within the financial markets and on international policy. He has been featured in the New York Times and NPR news amongst other financial publications.
More from Silver Phoenix 500


