Silver Price Forecast: Rare Signal Says Surge Ahead


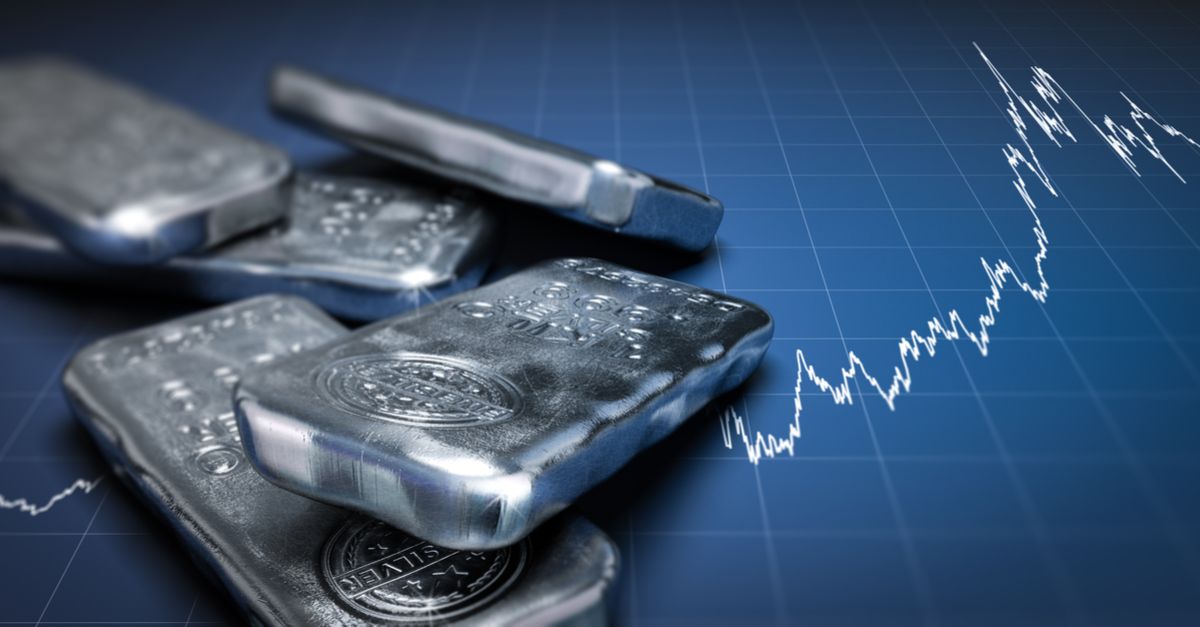
The precious metals are on the verge of flashing a signal that has only appeared three other times in the last twenty years. While the signal will be positive for all of the precious metals, it is silver that looks set to shine the brightest over the next several months.
Investors should carefully consider whether they have a proper allocation to the silver sector at this time.
The Gold to Silver Ratio
What is the signal we are referring to, which is flashing now for only the fourth time in the last two decades?
It is the breakdown in the gold to silver ratio.
In plain English, this ratio asks: how many ounces of silver does it take to buy one ounce of gold?
Let us examine the gold to silver ratio for the last 20 years:
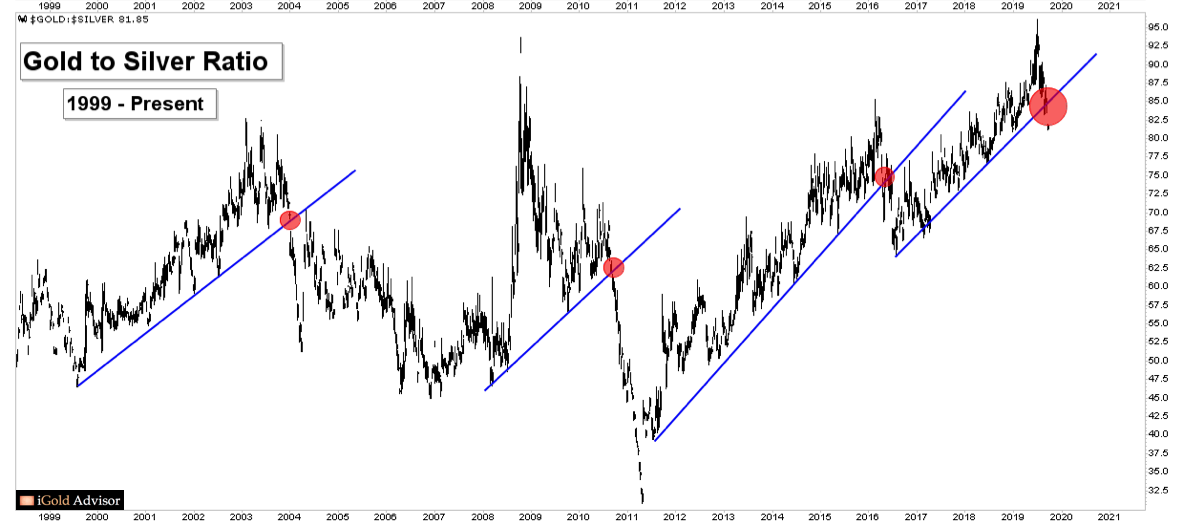
Note how the ratio has moved in wide swings, from above 80 down to near 40 every several years. Indeed, the ratio peaked at a multi-decade high above 95 just three months ago. This was the lowest that silver had been valued relative to gold in over two decades.
However, what is more important for investors is not the current value of the ratio, but rather the break in the trend of the ratio that is now unfolding.
Note the far right (large red) highlight, showing the break in a rising trend (blue), which has lasted since mid-2016.
Month after month for the last three years, silver has lost value relative to gold.
Yet something is changing – and that change is happening right now.
The higher trend in the ratio in favor of gold is breaking.
This is a significant development for investors across the precious metals spectrum, but especially so for silver investors.
The Signal’s Ramifications
In order to understand the ramifications of a trend breakdown in the gold to silver ratio, we must examine each of the previous three instances of the signal since 1999.
Let us juxtapose the above ratio chart next to the actual price of silver. With this comparison, we can properly view the reaction in the silver market that was foreshadowed by a breakdown in the gold to silver ratio:
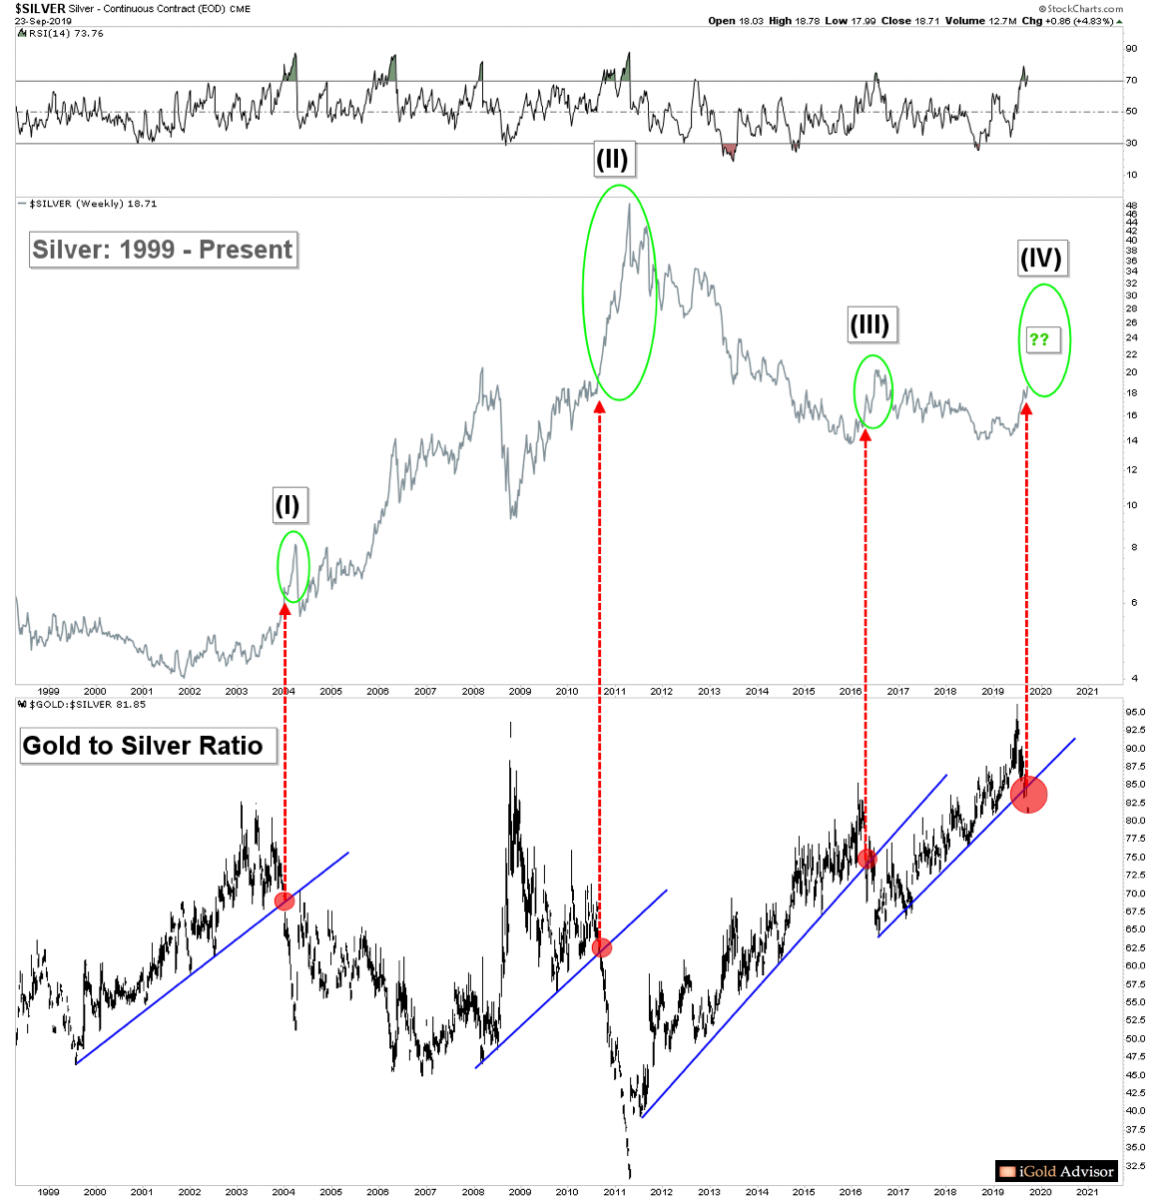
- The gold to silver ratio broke lower through a 4.5-year trend (blue) in January, 2004 (red highlight). At that date, the ratio stood at 69 ounces of silver to 1 ounce of gold. Within the next three months, the ratio declined to 51.
In the three months following the trend break, the price of silver rose by 40%, from $5.80 to $8.15 (green highlight).
- The gold to silver ratio broke lower through a 2.5-year trend (blue) in August, 2010 (red highlight). At that date, the ratio stood at 62 ounces of silver to 1 ounce of gold. Within the next eight months, the ratio declined to 31.
In the eight months following the trend break, the price of silver rose by 156%, from $19.40 to $49.80 (green highlight).
- The gold to silver ratio broke lower through a 5-year trend (blue) in April, 2016 (red highlight). At that date, the ratio stood at 75 ounces of silver to 1 ounce of gold. Within the next three months, the ratio declined to 64.
In the three months following the trend break, the price of silver rose by 37%, from $15.50 to $21.25 (green highlight).
Summary Analysis
Three multi-year trend breaks have been observed in the gold to silver ratio since the start of the millennium.
On average, the subsequent surge in silver has lasted for 4.6 months and resulted in a 77.6% gain in price.
While the sample size thus far is only three, there have been exactly zero occasions in which a breakdown in the ratio did not result in a significant multi-month surge for silver prices.
Back to the Present
This same signal is now appearing for only the fourth time in the last 20 years.
Note the far right (larger) red highlight circle.
Currently at 82 ounces of silver to 1 ounce of gold, the ratio has just broken a 3+ year primary rising trend (blue) again.
If history is any guide, we should expect a multi-month to multi-year silver advance to soon unfold.
From the present price of silver at $18.70, the minimum 37% surge as was seen in 2016 would take prices to $25.61 by December 2019.
If the maximum 156% surge as was witnessed in 2010 repeated, prices would reach $47.87 by May 2020.
How to Invest for the Silver Price Surge
Investors should prepare for a price spike in silver that should target the mid-$20’s at minimum within the next 4-6 months. Beyond that, we will need to re-evaluate as the move develops.
Physical metals investors should experience healthy gains ahead.
Traders will have plenty of opportunity to time short-term swings higher and lower over the subsequent months.
Yet our preferred way to invest in the sector at the present is in the silver mining complex. Consider that during the 2016 surge, the average junior silver miner as referenced by the SILJ fund rose by an incredible 375%:
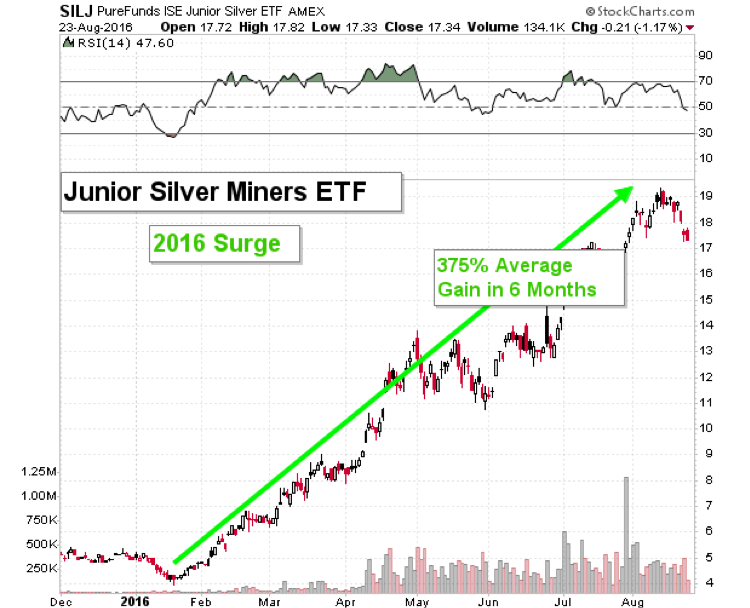
Of course, the present breakdown in the gold to silver ratio could result in a greater or lesser percentage gain than the 2016 example.
Further, the above fund shows only the average silver miner. Some miners may gain more, and some may gain less on the pending silver move.
To learn more about the specific silver miners we are investing in here which we expect will outperform the averages, check out our work at www.iGoldAdvisor.com
Takeaway on the Gold to Silver Ratio
A positive signal which has appeared only three times in the previous 20 years is now visible again in the precious metals markets.
Investors across the physical metals and mining sector should prepare for a significant opportunity starting immediately.
*********

Christopher Aaron began his career as an intelligence analyst for the CIA and Department of Defense. He served two tours to Afghanistan and Iraq between 2006 - 2009, conducting pattern-of-life mapping for military leaders.
Mapping shares similarities with technical analysis of the financial markets because both involve the interpretation of repeating patterns found in human nature. He is the founder of iGold Advisor, providing independent research and analytics on all aspects of the precious metals markets.
He speaks regularly on the cyclical patterns found within the financial markets and on international policy. He has been featured in the New York Times and NPR news amongst other financial publications.


