Silver Price Update…Stay Sober


Time to revisit the “play toy of the funds”, aka, silver.
On Thursday of this past week, silver managed to claw its way back above its down trending 10 day moving average, a positive sign. However, ahead of an often unpredictable payrolls report, most traders are not going to get aggressive…preferring instead to wait for the report and the reaction before committing precious capital.
The reaction to the report was one of bullishness as the market pushed further away from the 10 day hitting the 50 day before retreating off of that level.
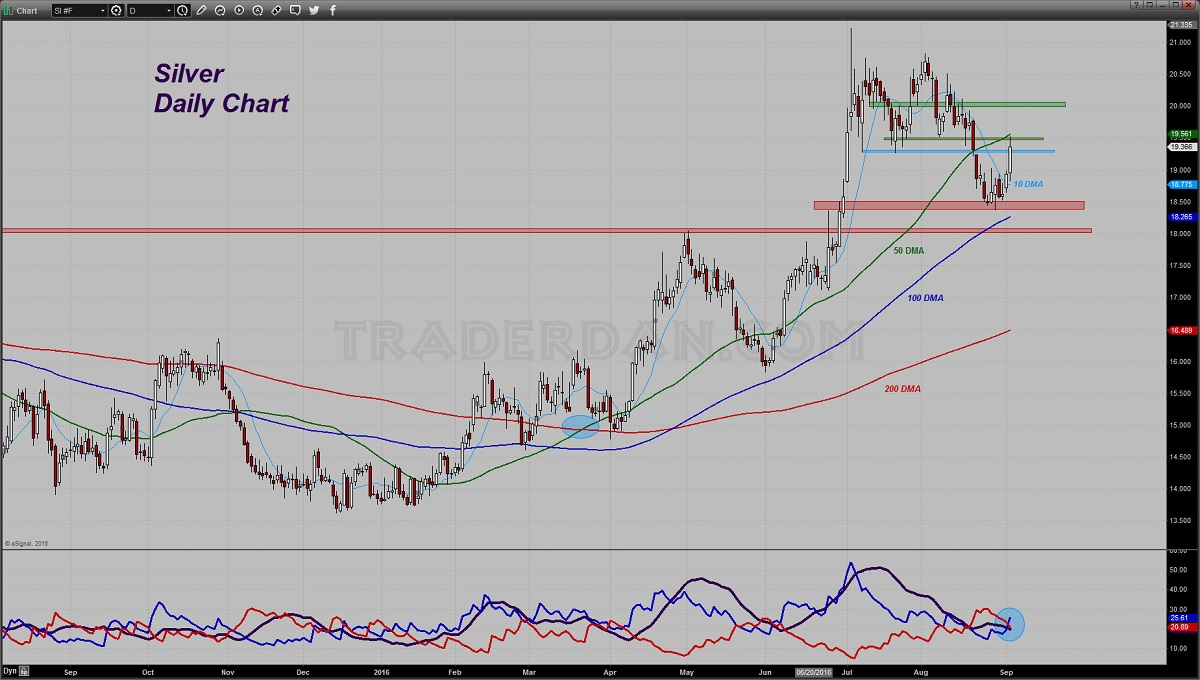
Notice that the push through the 10 day and more importantly, the ability to clear the first resistance hurdle near $19.30 flipped the ADX/DMI into generating a buy signal.
I am watching closely how the metal handles this 50 day moving average which coincides quite nicely with the next level of overhead resistance near the $19.50-$19.55 zone.
Whether this is a retracement higher in a market entering an intermediate term downtrend or the resumption of a longer term uptrend is yet unclear. The 50 day moving average will go a long way in helping us decipher it.
If you are a follower of the Heikin Ashi method, this chart has generated a buy signal as well.
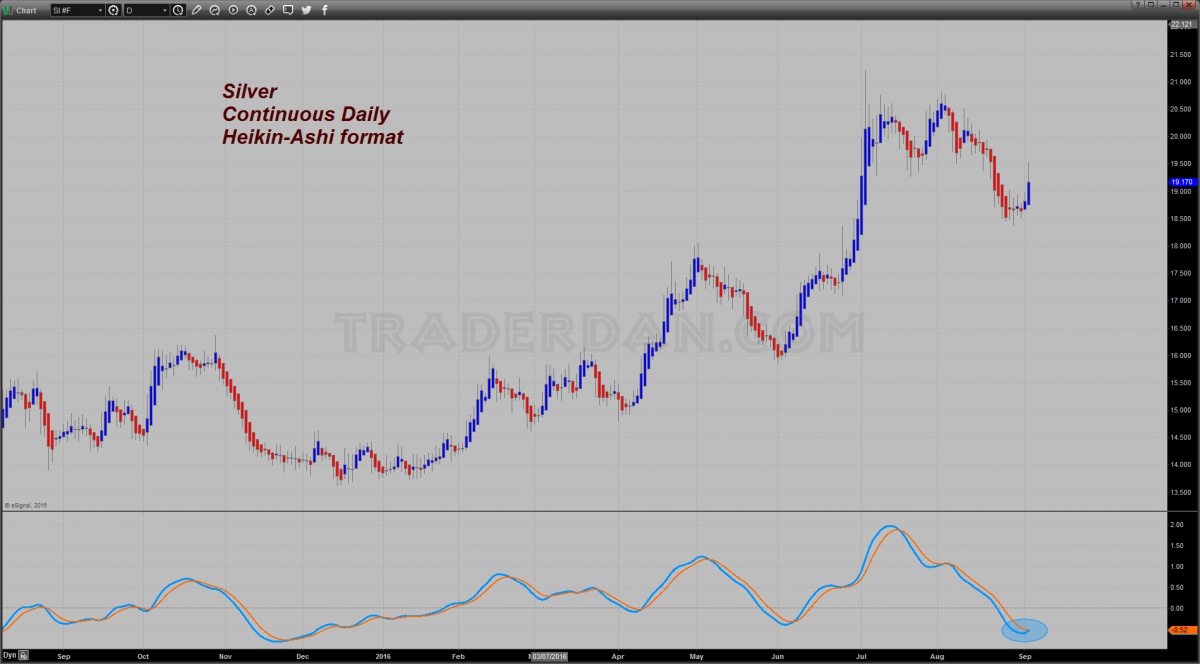
It is important however to note, as I mentioned above, the intermediate term trend for silver is LOWER. The Daily trend has flipped higher but the following chart shows the reason to temper any bullish enthusiasm.
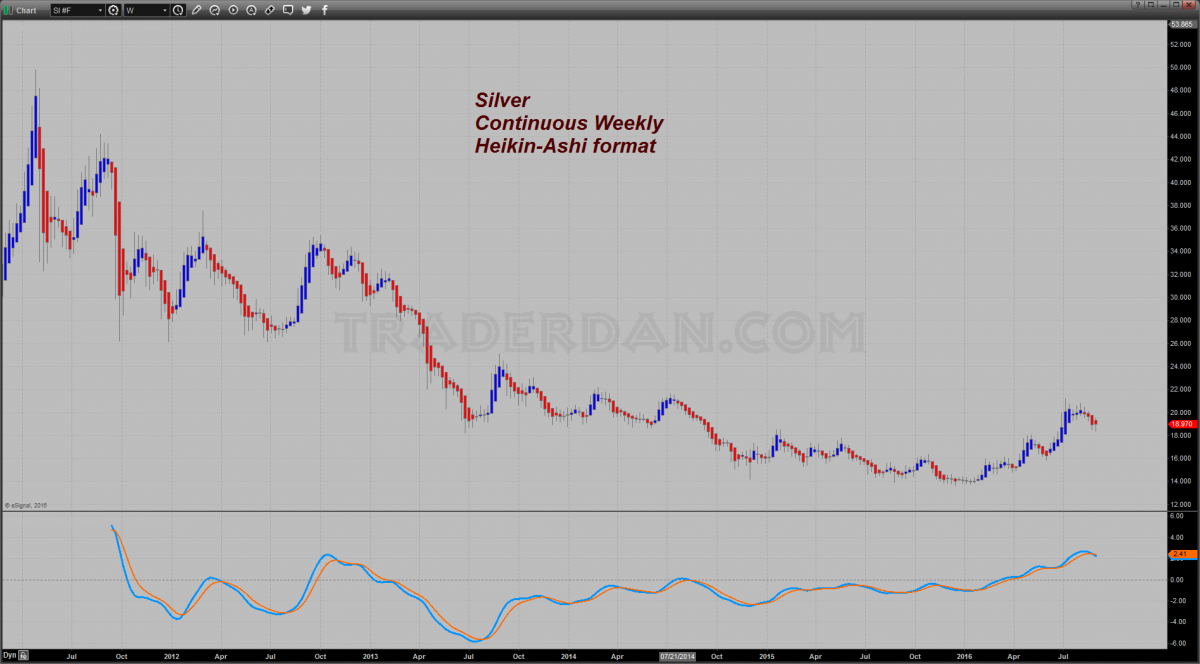
Here is the same Heikin Ashi format applied to the Weekly or Intermediate term chart. Notice it is in a bearish mode. Understand that if you are taking the buy signal on the Daily Heikin Ashi chart you are going against a Bearish pattern on the larger time frame chart of the same format. Just do not get married to your long position. I for one need further confirmation as I generally do not like to trade against an intermediate term trend unless I really feel that I have a firm/solid grasp of the fundamentals driving the market. That is important why this week’s low will need to hold firm and why I would prefer to see the 50 day moving average bested. That would confirm that the intermediate term is firming up (50 day – intermediate term; 200 day = long-term).
Need some more data? Check out the standard candlestick chart for the intermediate-term time frame.
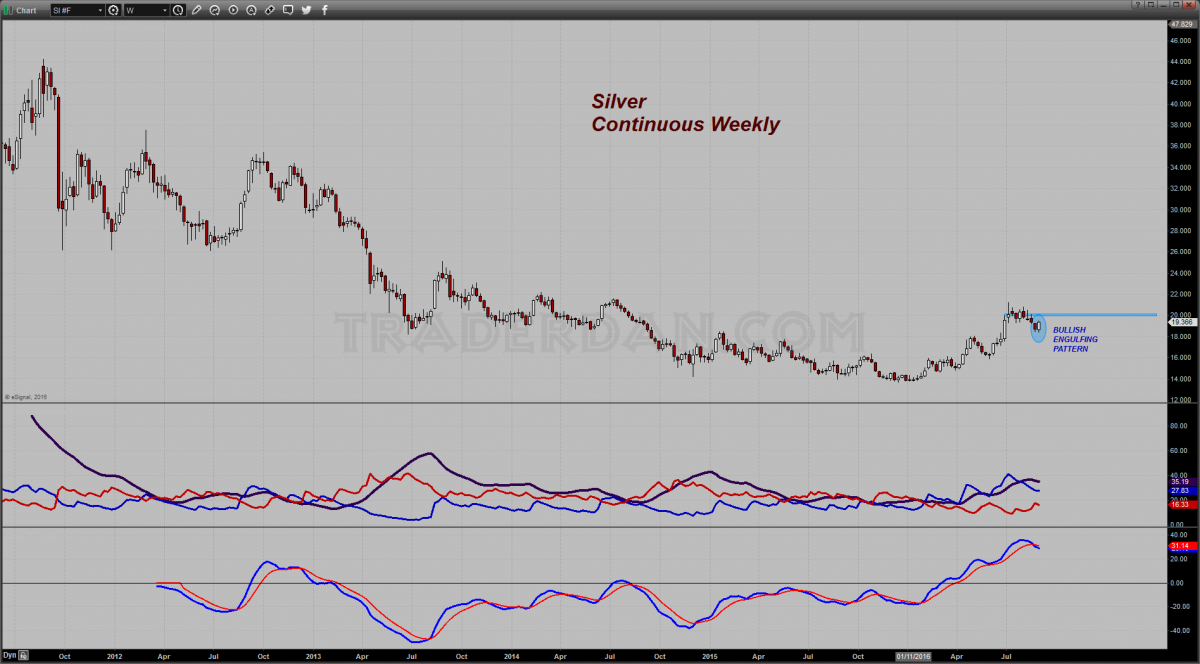
Notice that in this format, the weekly chart shows a BULLISH ENGULFING PATTERN. You can also see that $20 is the next big test for silver bulls, should they be able to push past that 50 day moving average on the Daily chart.
In looking at the ADX/DMI indicator, the ADX line has turned down which confirms the recent pause in what had been a good trend higher on the weekly chart. However, the +DMI has remained above the -DMI the entire time this market has been moving lower indicating that the bulls still have control over this market.
Adding further uncertainty is the fact that the TSI which has generally kept you on the correct side of a trade, is now in a bearish posture. In other words, there is not a lining up of all the indicators on this time frame.
That is why the onus is now firmly on the bulls to add to the bullish engulfing pattern and close this market strong next Friday if we are to see a good month for silver in September.
I want to add here that if some of the readers are trading silver in the futures market, there is a mid-sized silver contract of half size (2,500) ounces if the full size (5,000 ounces) is just too much to handle for your risk tolerance. Silver has made a decent number of folks who trade the futures some good money but it has also cleaned out far more. Its wild price swings and huge range is why the funds love trading it because it is so thin, it can be easily shoved around, in contradiction to gold, which is far more liquid and behaves in a far more orderly fashion that this wacky metal.
As far as the Commitments of Traders report goes, it really is not much help to us this week seeing that silver’s gains – during which it blasted through the 10 day and ran to the 50 day moving average- all occurred on Thursday and Friday of this past week, well after the Tuesday cutoff date.
Consequently, here is a look at what we had in the market as of Tuesday.
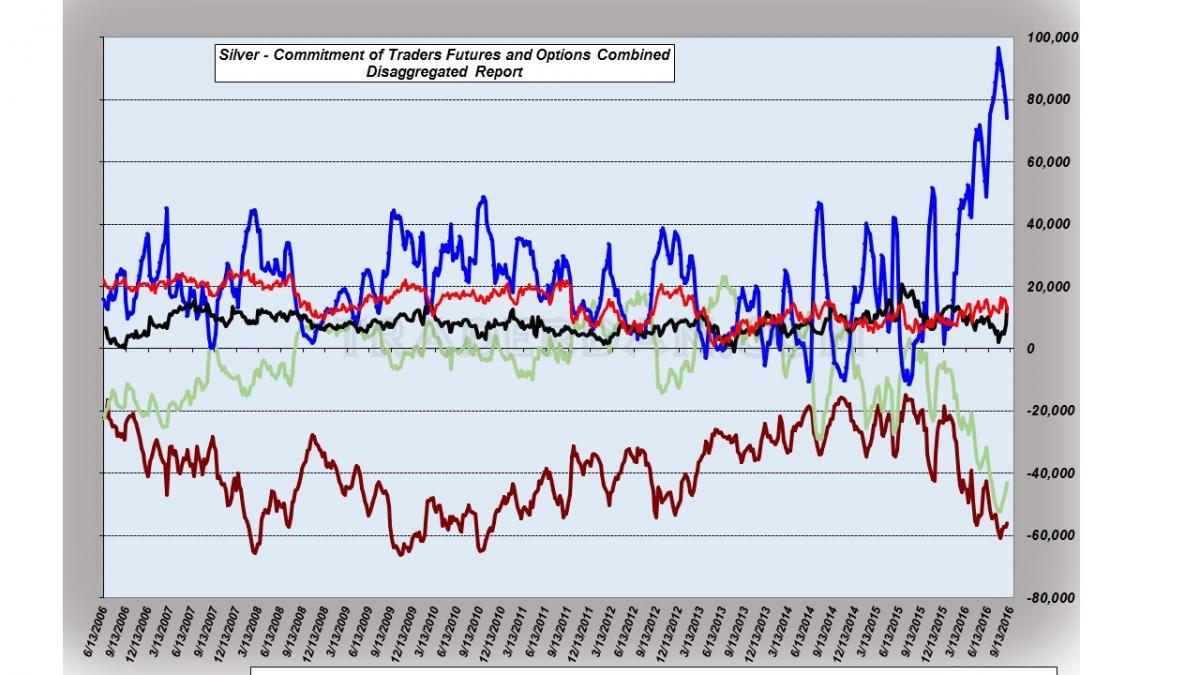
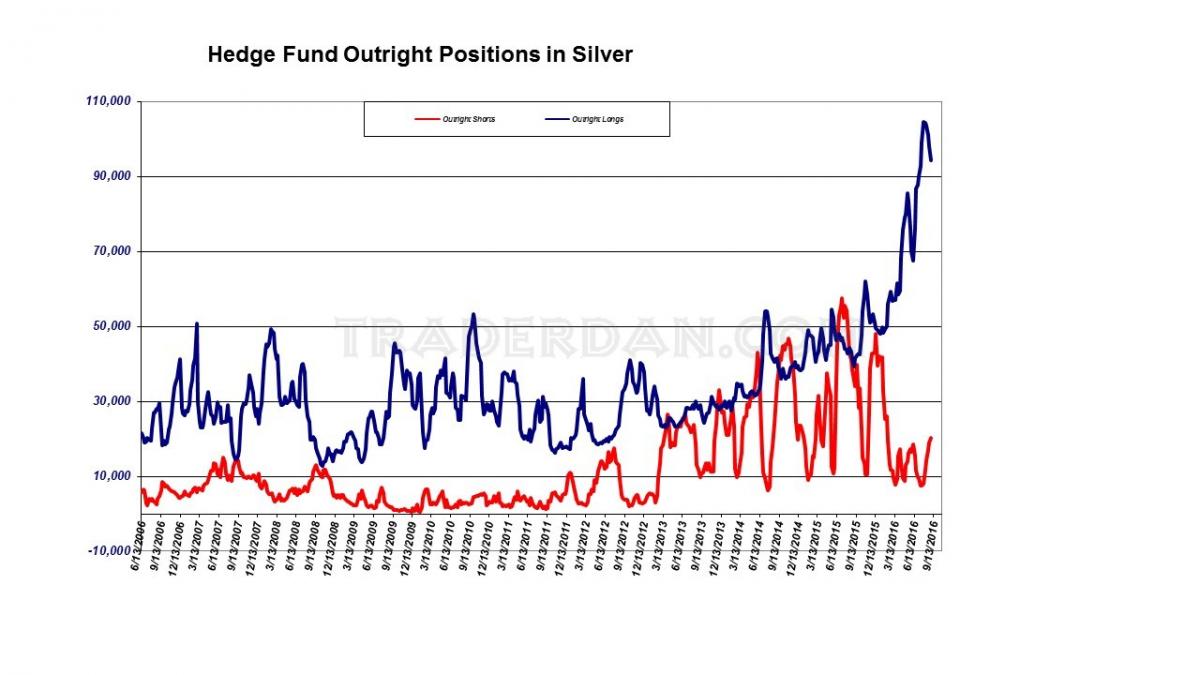
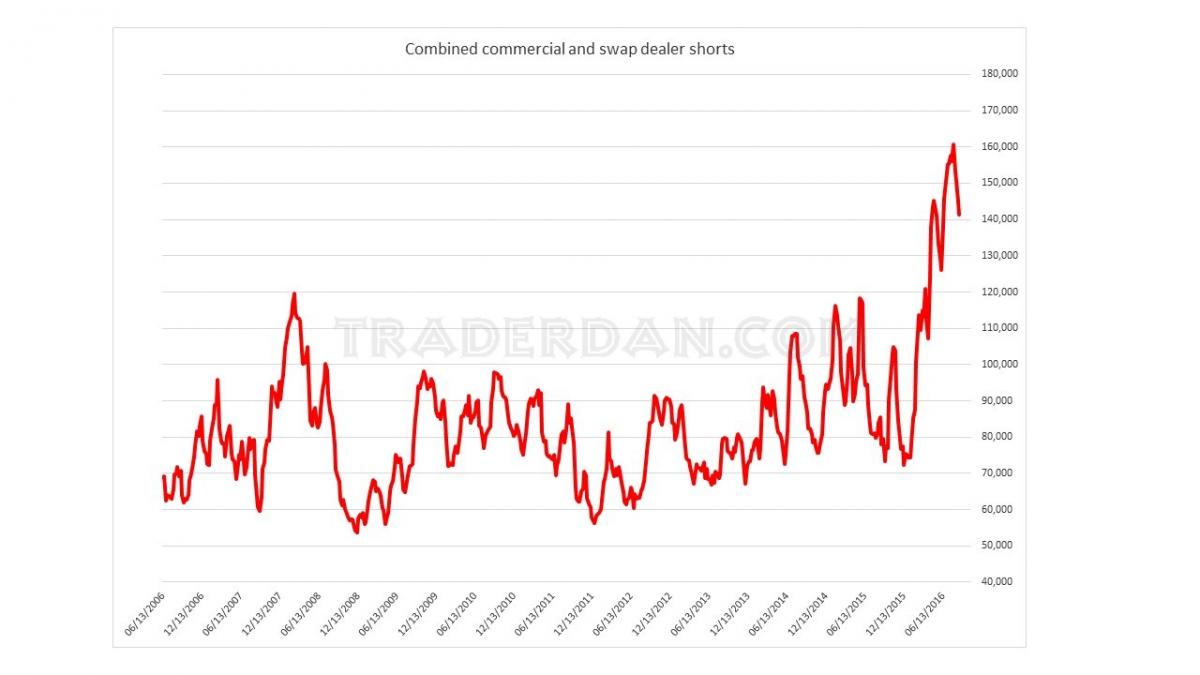
Hedge funds had been busy liquidating existing long positions as well as adding some fresh shorts with Commercials and Swap Dealers using their selling to cover their existing short positions.
There is also something else in this report worth noting.
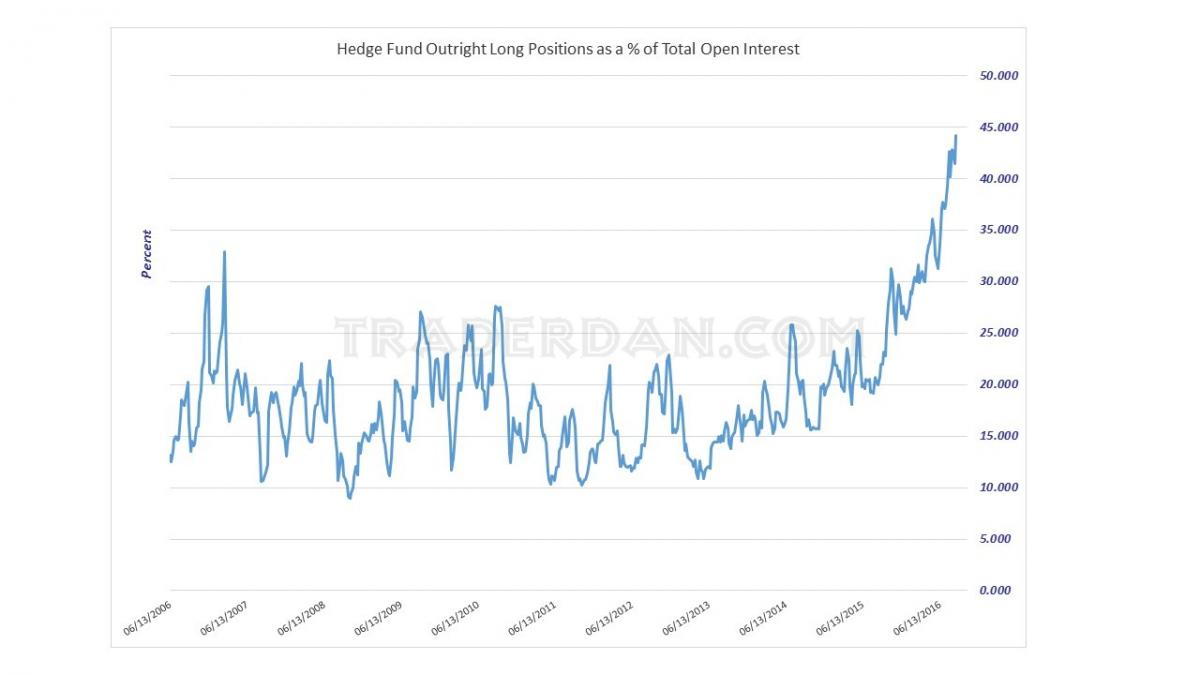
While hedge funds were indeed liquidating some longs, compared to the sharp drop in open interest tied to the delivery process in the September contract and the shift into the December, their overall long position, as a percentage of total open interest, is at a new all-time record high.
Hedge funds, notwithstanding their recent reduction in long positions, remain extremely bullish on silver.
AS long as this recent upside momentum remains intact, this should pose no problem, but as we have seen time and time again, any hesitation to move higher, any loss of upside momentum, and this fickle crowd will have to be watched for further long liquidation.
Some additional comments – here is a chart of the Dow Jones/UBS Commodity index. This is something I always look at when analyzing silver.
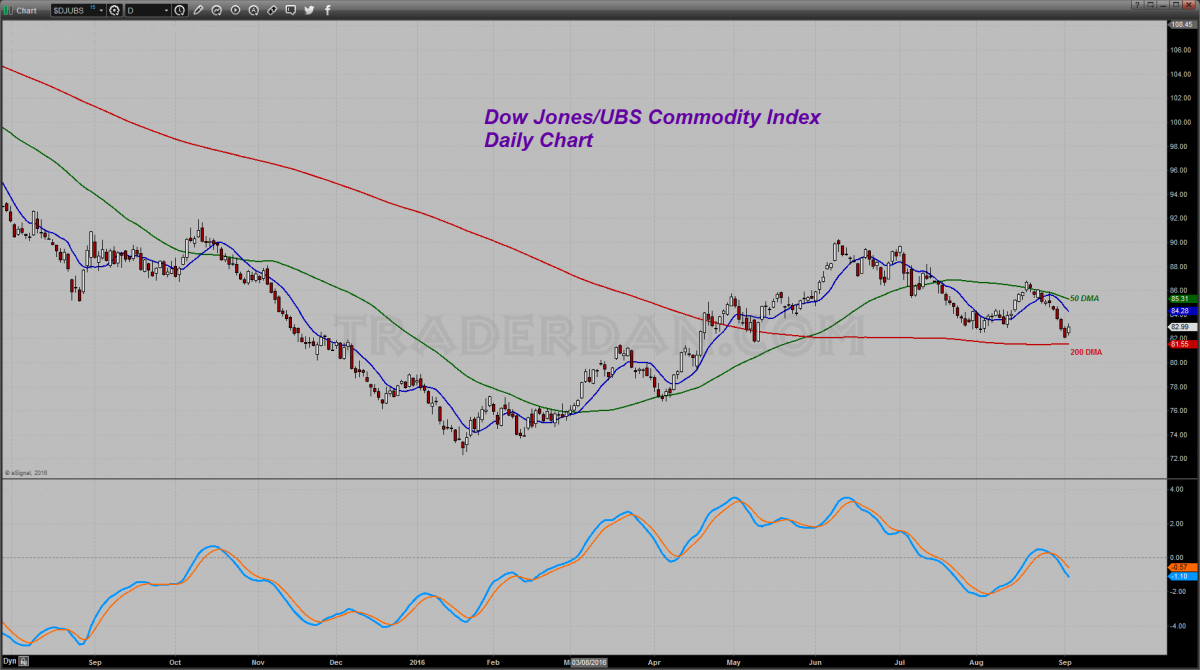
I have detailed quite often how silver tends to track very closely with the overall commodity sector.
Notice how the index is trading well below its 50 day moving average, which has turned lower. That indicates that commodities as an asset class are in an intermediate term downtrend. Long term they still remain above that 200 day moving average which is offering support for now.
This is also the reason that I am baffled by the bond markets as noted in a previous post. The yield curve continues flat, the TIPS spread is showing inflation running below the Fed’s target rate of 2% and the commodity sector is showing no signs of any incipient inflation pressures whatsoever. That is hardly a recipe for any sort of inflation play when it comes to silver.
I have noted before that silver generally needs an inflationary environment in which to thrive. For comparison’s sake, here is a weekly chart comparing the general price direction of silver against the commodity index.
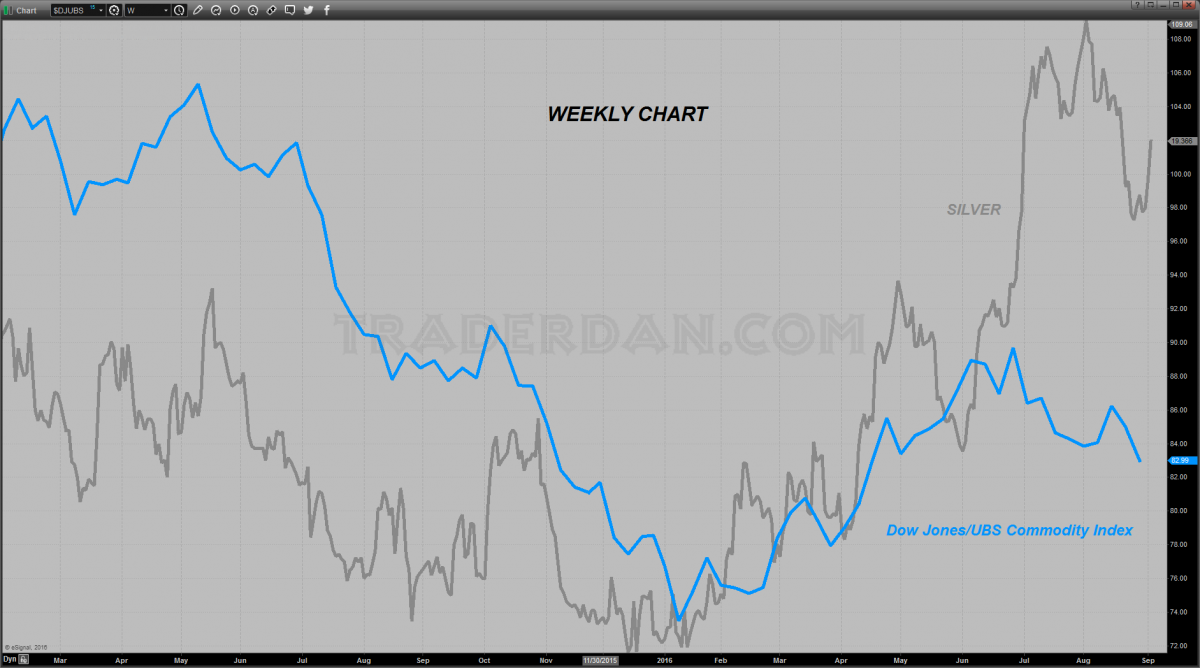
The two tracked almost perfectly in sync until June of this year when silver diverged moving higher as the overall sector dropped lower. Why that occurred is unclear to me but I suspect it had more to do with negative interest rates and some viewing silver as a safe haven more so than an industrial metal truth be told. Silver is fickle when it comes to such things as one never knows when the market will look at it as a safe haven and when it will be viewed as an industrial metal.
Speaking Of Industrial Metals – Here Is Copper
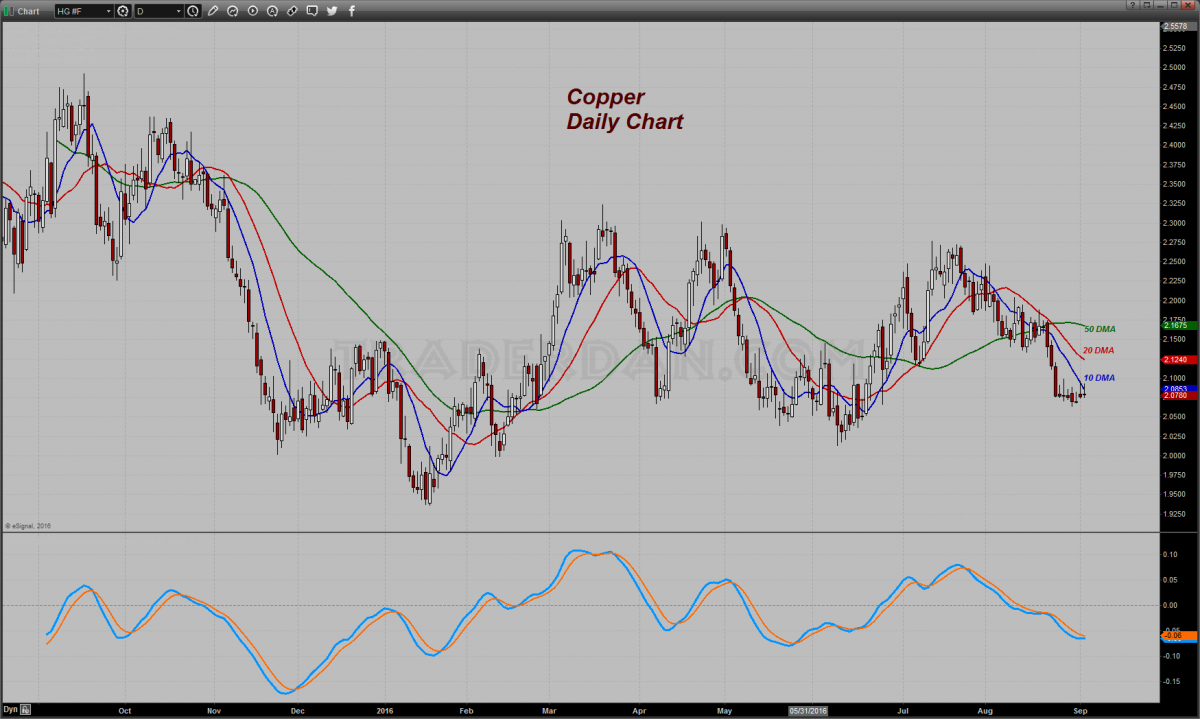
Not very optimistic looking is it when it comes to growth prospects!
As a matter of fact, hedge funds have recently been piling on the short side of the red metal yet again.

One of the things that really stands out to me is how rapidly and how often these same hedge funds have been flopping back and forth between being big longs in copper and being big shorts in copper. Since the spring of last year (2015) look at how many reversals we have seen in the red metal as far as hedge fund positioning goes.
Talk about a lack of direction! This is what I mean when I say that Central Banks have unleashed nothing but confusion and uncertainty into these markets as they continue to distort whatever fundamentals might currently exist out there. The result is a mad, frenzied flipping and flopping back and forth among large speculators who are attempting to get a clear read on economic growth prospects or the lack thereof.
Just look at this idiocy again…
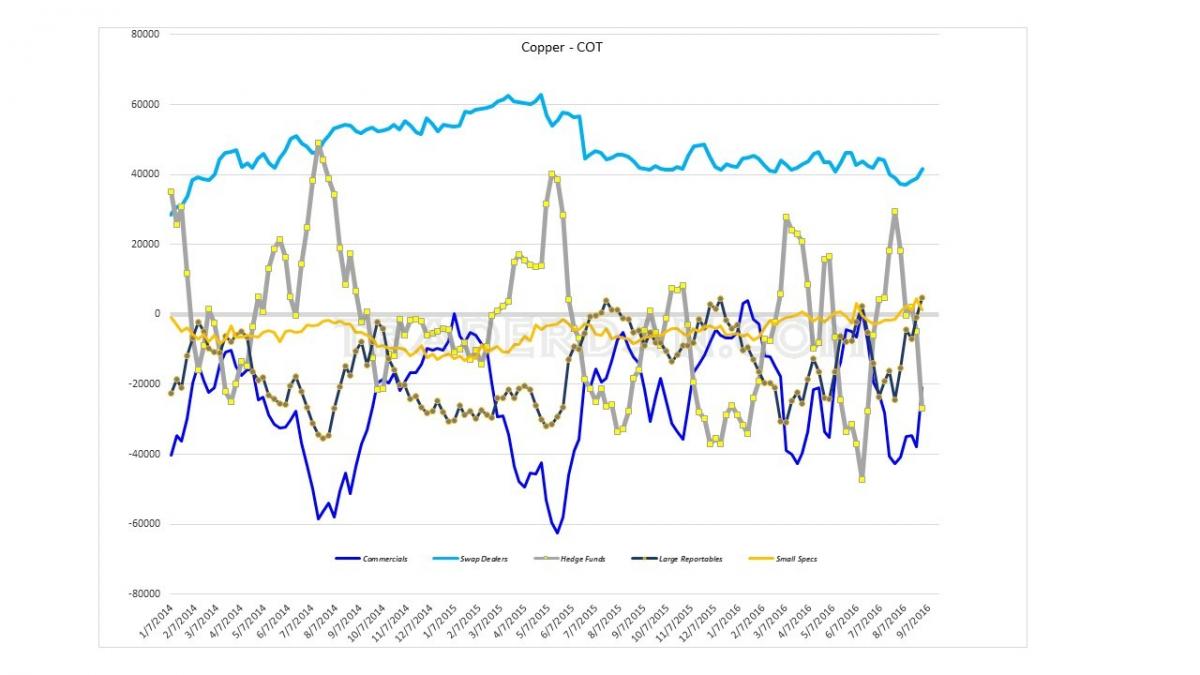
In the middle of June of this year hedge funds had a massive net short position. Less than 6 weeks later, they had moved completely to a massive net long position. Now, here we are a month later, and they are back to a sizeable net short position again! See what I mean about Central Bank inspired madness.
No market ever trades like this if it is normal. Sentiment simply does not flip back to such extremes in such a short span of time if it is healthy. What you are witnessing in copper is every bit the result of Central Banks producing distortions in the economy and confusing traders.
Copper used to be one of the most accurate, the clearest, sure fire barometers out there for gauging the strength of not only the domestic economy, but the global economy. Now, thanks to these pestilential, constantly interfering, meddling Central Bankers, who believe it is their God-ordained task to short circuit bear markets in stocks and the process by which oversupply and imbalances are cleared in a healthy functioning economy, copper is like a faulty digital thermometer which has a malfunctioning circuit board. It has no idea what to do.
I said all this to merely caution the readers – do not make dogmatic assumptions about any of these major markets in this environment. If you do, you run the real chance of not only looking like a complete fool, but also losing a large amount of your trading capital. This is not the environment in which to try playing the hero lest you end up being nothing but a huge zero. Stay sober-minded and stay cautious. Leave the cheerleading, the ra-ra-ra and the “to the moon” crap to the crowd that seems to never learn humility and their own sense of fallibility.
******** .
Courtesy of Trader Dan http://traderdan.com/
More from Silver Phoenix 500


