Silver Price Update


During gold’s takedown over a week ago, silver rather surprisingly escaped relatively unscathed, a resilience that we can put down to this market already being very depressed, with its COTs showing little speculative interest even before the latest drop.
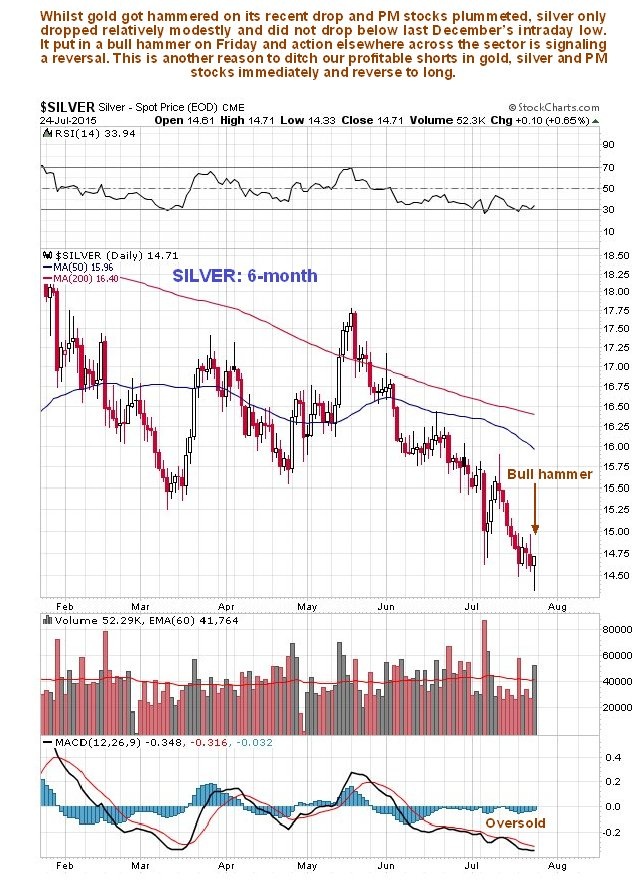
On its 6-month chart we can see that, like gold, silver put in a fine bull hammer on Friday on good volume, and this, along with evidence elsewhere across the sector, suggests that a short-term rally is in the offing, even if the outlook remains bleak over the longer-term. Silver is a trading buy here with a stop beneath Friday’s intraday low.
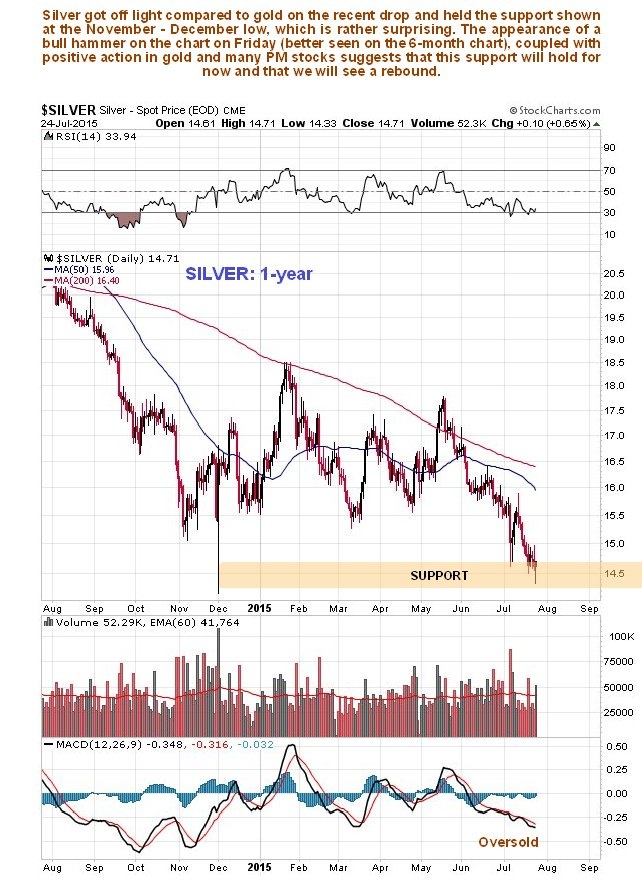
The 1-year chart is more interesting and shows that, while gold crashed an important support level, silver did not – it did not break below the support at its intraday low during a day of wild trading late at the end of November - beginning of December. It is oversold and at the support near this low, so at a good point for a relief rally to develop, although we should not lose sight of the bearish alignment of its moving averages which we can expect to act as a restraining on any rally in the near future.
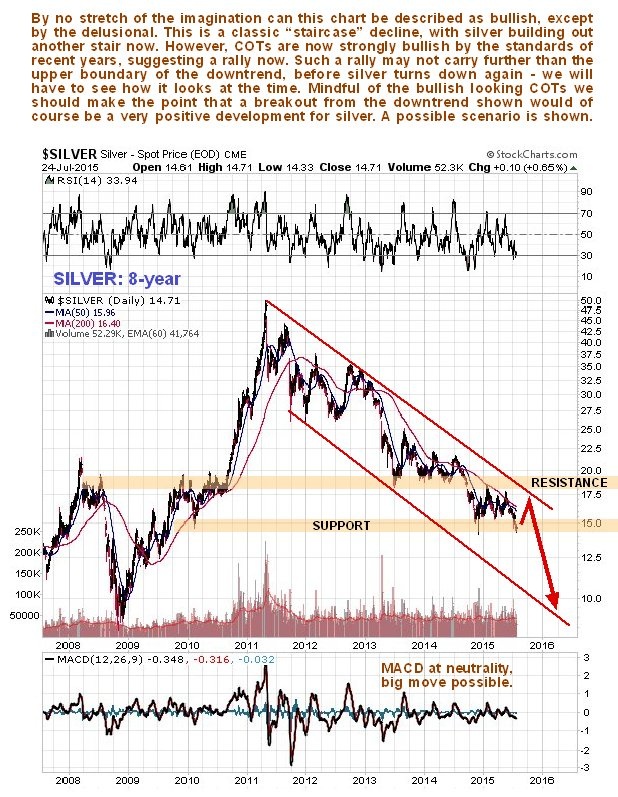
The long-term 8-year chart shows that silver remains stuck in a bear market with a “staircase” decline in effect within a persistent downtrend. While the latest COTs certainly look encouraging, the fact of the matter is that this downtrend remains in force and it will take a clear break out of it to change this situation. On this chart we can gauge the magnitude of any short-term rally, which if it carries to the upper boundary of the downtrend, as COTs and other factors suggest is likely, would see the price ascend to the $17 area before turning lower again, with a possible scenario shown on the chart. If the support near last year’s lows is eventually breached, then another severe down-leg will be in prospect as shown.
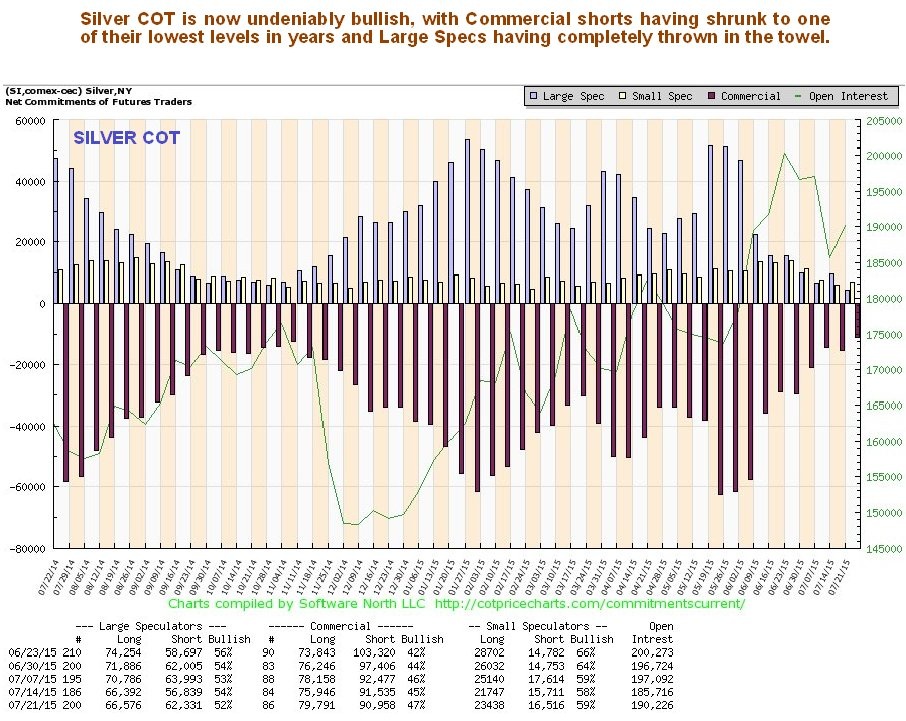
Silver’s latest COT looks bullish here, at least for the near-term, for as we can see the Commercials have scaled back their shorts to a low level, while the Large Specs have given up and “thrown in the towel” and now have their lowest holdings for a long time, possibly years. There is nothing to say, however, that in the future we won’t have a situation where the Commercials are routinely long and the Large Specs short, if this bear market continues.
The longer-term Silver Hedgers chart likewise looks bullish. This chart also reveals the huge reduction in Commercial short positions in recent weeks. As we can see, readings at these levels have typically preceded rallies in the past.
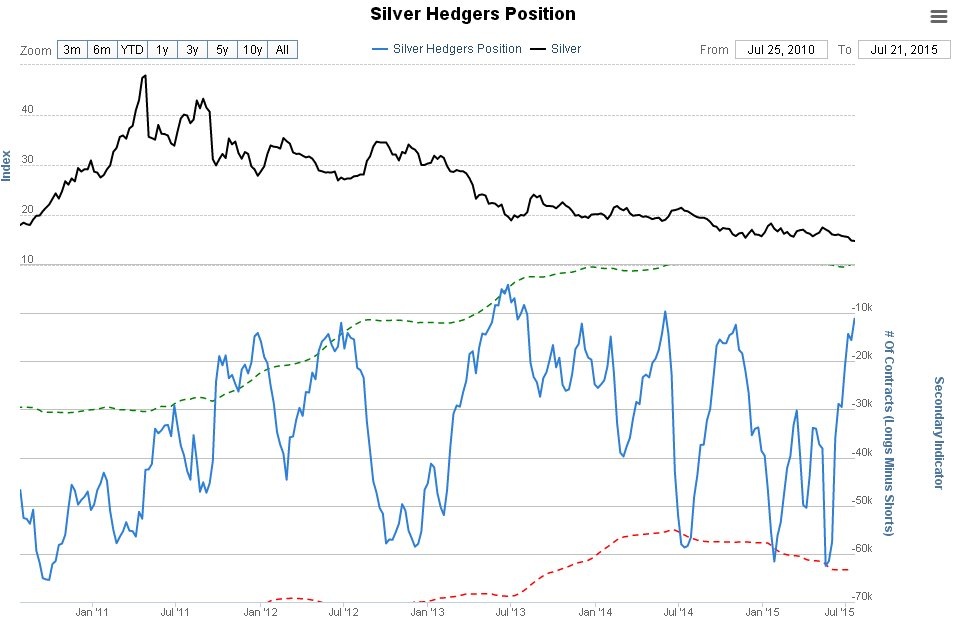
Chart courtesy of www.sentimentrader.com
Lastly the Silver Optix, or optimism index, shows a low level of optimism towards silver that has also typically preceded rallies in the past.
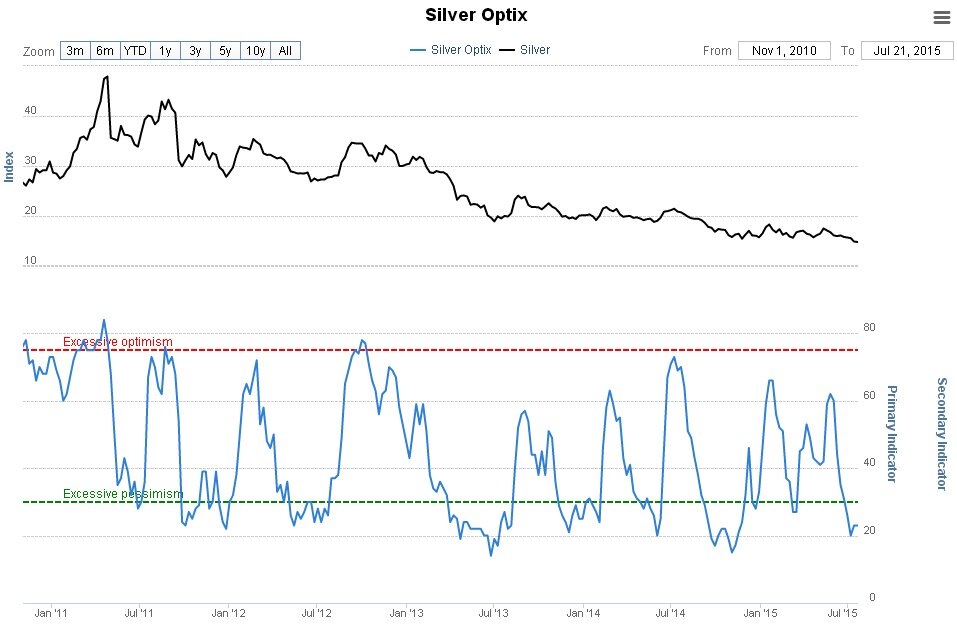
Chart courtesy of www.sentimentrader.com
Both these sentimentrader charts go back to early 2011, in order to show the entire period from the bull market high of April – May 2011.
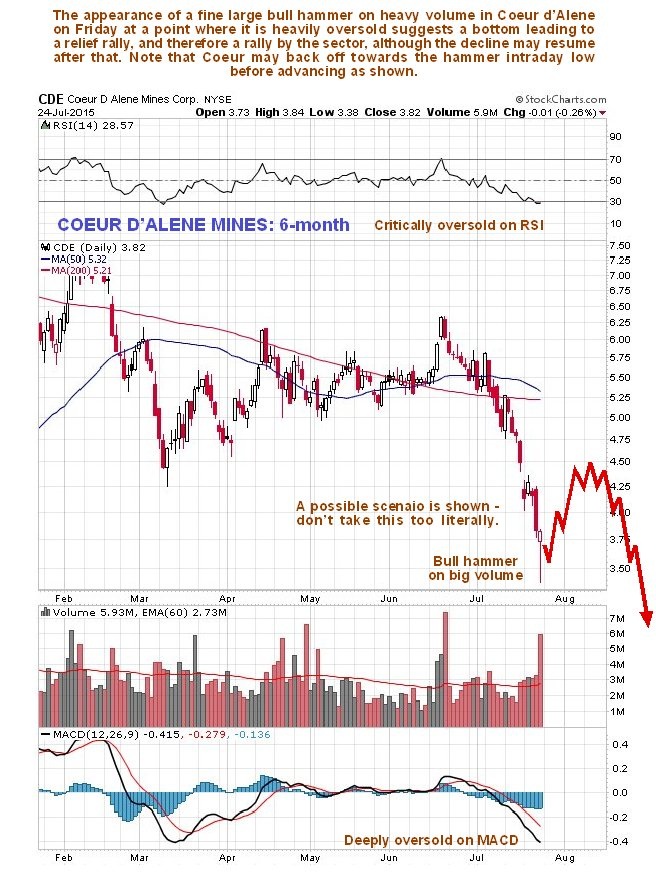
Finally, the chart for Coeur D’Alene Mines shown below provides circumstantial evidence that at least a short-term bottom is in, as it shows an accelerating decline into a low, where at an oversold extreme a fine large bull hammer appeared on the chart on heavy volume on Friday. A possible scenario from here has been drawn on the chart, which shouldn’t be taken too literally. Traders may consider going long CDE with a stop beneath Friday’s intraday low, with the aim of exiting the position on a rally and perhaps then reversing to short again.
********
Courtesy of http://www.clivemaund.com


