Silver To Rally Due To Coming Dow Crash


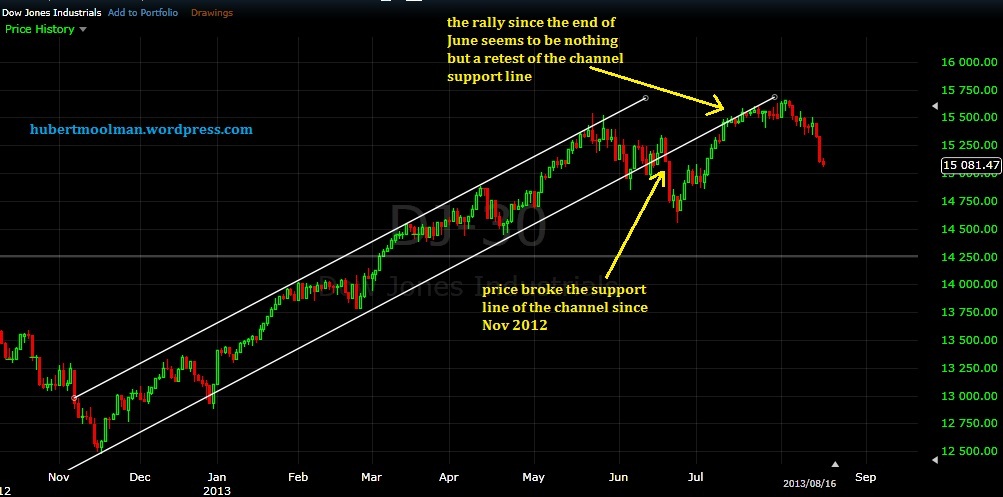
Since the last update, the Dow has had a rally which exceeded the previous all-time high. The rally appears to be nothing significant, since it was likely just a retest of the previous breakdown – See the Dow -chart below (from freestockcharts.com):
As previously stated, I believe the Dow to be the main obstacle to Gold and Silver’s major rallies. So, just as I expect the Dow to drop violently, I expect a violent rise in gold and silver at roughly the same time. This is because it is likely the same panic that causes the Dow fall that will make value to run towards gold and silver.
Also, let us not forget the bigger fractal pattern on the Dow chart (70s vs current):
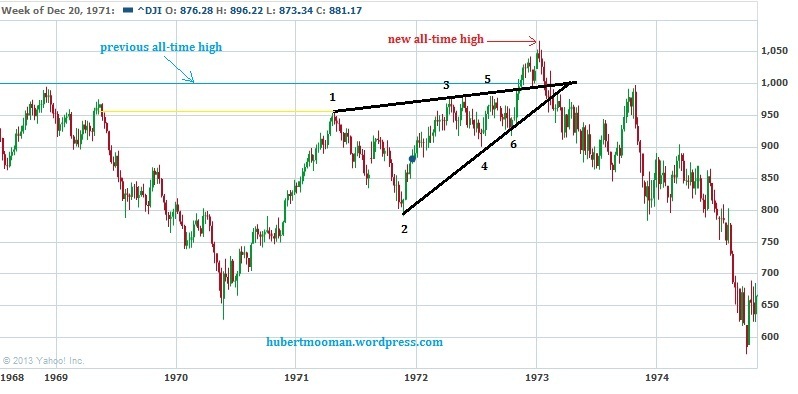
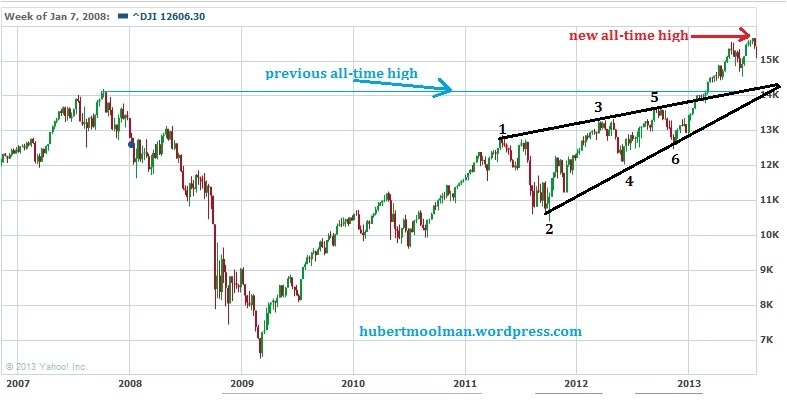
The top chart is the Dow from 1968 to 1974, and the bottom one is the Dow from 2008 to 19 August 2013. I have illustrated how these patterns are alike by marking similar points from 1 to 6. The Dow is now really stretching the possible timing for the collapse to an extreme.
In my opinion, the only thing possibly keeping the Dow from crashing now (if it is not busy crashing now), is the fact that we are not in October (its favourite peak month), yet.
Note that we are still in the period of risk aversion, as explained in my previous update, which creates the ideal conditions for the Dow to fall while gold and silver eventually rises. Gold rallies during periods of risk aversion are often the most aggressive ones. An example of a gold rally that occurred during a period of significant risk aversion was the one from July 2011 to early September 2011.
During that two-month period gold rose from $1480 to $1920 (a good 30%), while the Dow fell about 13% at the same time.
Silver and the Gold/Silver Ratio
Silver’s recent performance could be the best evidence that the current gold and silver rally could be “the real thing”. This is because silver has significantly outperformed gold since the beginning of August. We can see that from the gold/silver ratio, below:
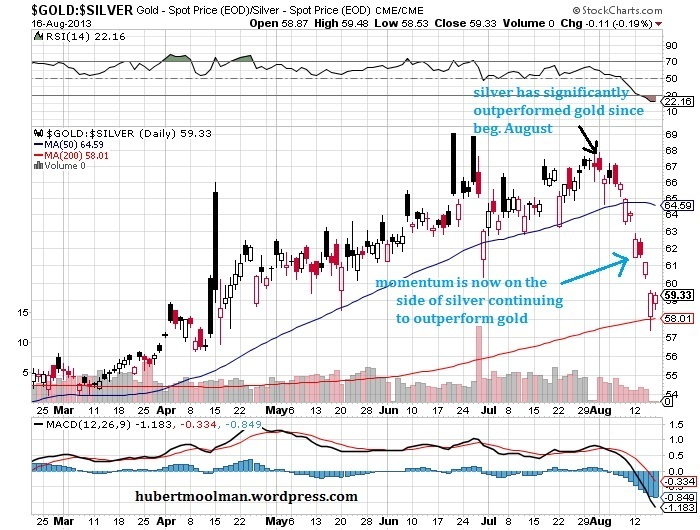
So, I continue to believe that continuing to exchange gold for more silver at these levels, is a move that one is extremely likely to be well rewarded for. It would make no sense to buy gold over silver, given that one expects that silver will outperform gold by a factor of at least two. That is that I expect the Gold/Silver ratio to fall to be at least lower than 30.The silver chart is also sending many positive signals. Below, is a monthly silver chart:
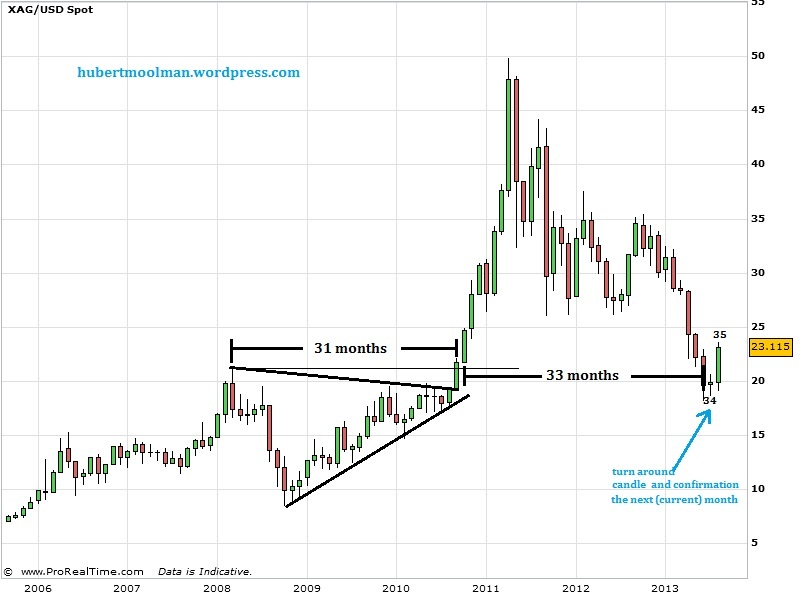
The current bottom occurred during month 33 since the breakout of the top of the 2008 – 2010 triangle. Bottoms often occur on day 33 or month 33 from a bottom or a breakout. This makes it very likely that the bottom in June 2013 was the final bottom, especially since it occurred almost exactly at the breakout from the 2008 – 2010 triangle (around the $18.50 area).
If you refer to my previous update – section: Using gold to forecast silver (From a timing point of view) – you will find on page 8 that I concluded that silver’s final rally to its peak could start at any time (then – 25 June 2013). Also, from that same comparison, it appears that silver is fast running out of time with the current pattern as compared to the 70s pattern (but, more details on this with a next update).
********
For more of this kind of analysis on silver and gold, you are welcome to subscribe to my premium service. I have also recently completed a Long-term Silver Fractal Analysis Report .
More from Silver Phoenix 500


