The Silver Watch Timing


Covid has a dramatic impact on productivity and business. As such, the burdens on governments and their budgets are enormous. The likelihood of a fiscal stimulus in U.S. to have fruitful effects to produce economic growth and as such value is extremely diminished. Looking at charts across all asset classes, we find markets extended to standard deviations that typically return to their means even if temporarily sustaining such extremes. Timing, the Silver watch.
Intermarket relationships typically cause margin calls once a snowball effect is in place in a temporary crash.
Timing is everything!
It isn’t smart to try putting all eggs in one basket and hoping for the best. Various asset classes can and at some point will each go through a dramatic dip. For example:
- When real estate, Russel 2000, S&P, Dow, and Nasdaq roll over, consecutively you want to be out of these markets.
- In case of Gold, Silver and crypto, money needing to hold up margin calls for miss speculation in those markets could drive them lower. Hence, during such times you want to be out of those markets.
- When your cash will lose half of its worth, you don’t want to hold cash.
- But when hyperinflation hits, you need to be fully invested in safe havens like Gold, Silver, Platinum, and Bitcoin.
Silver, Weekly Chart, Timing assumed right:
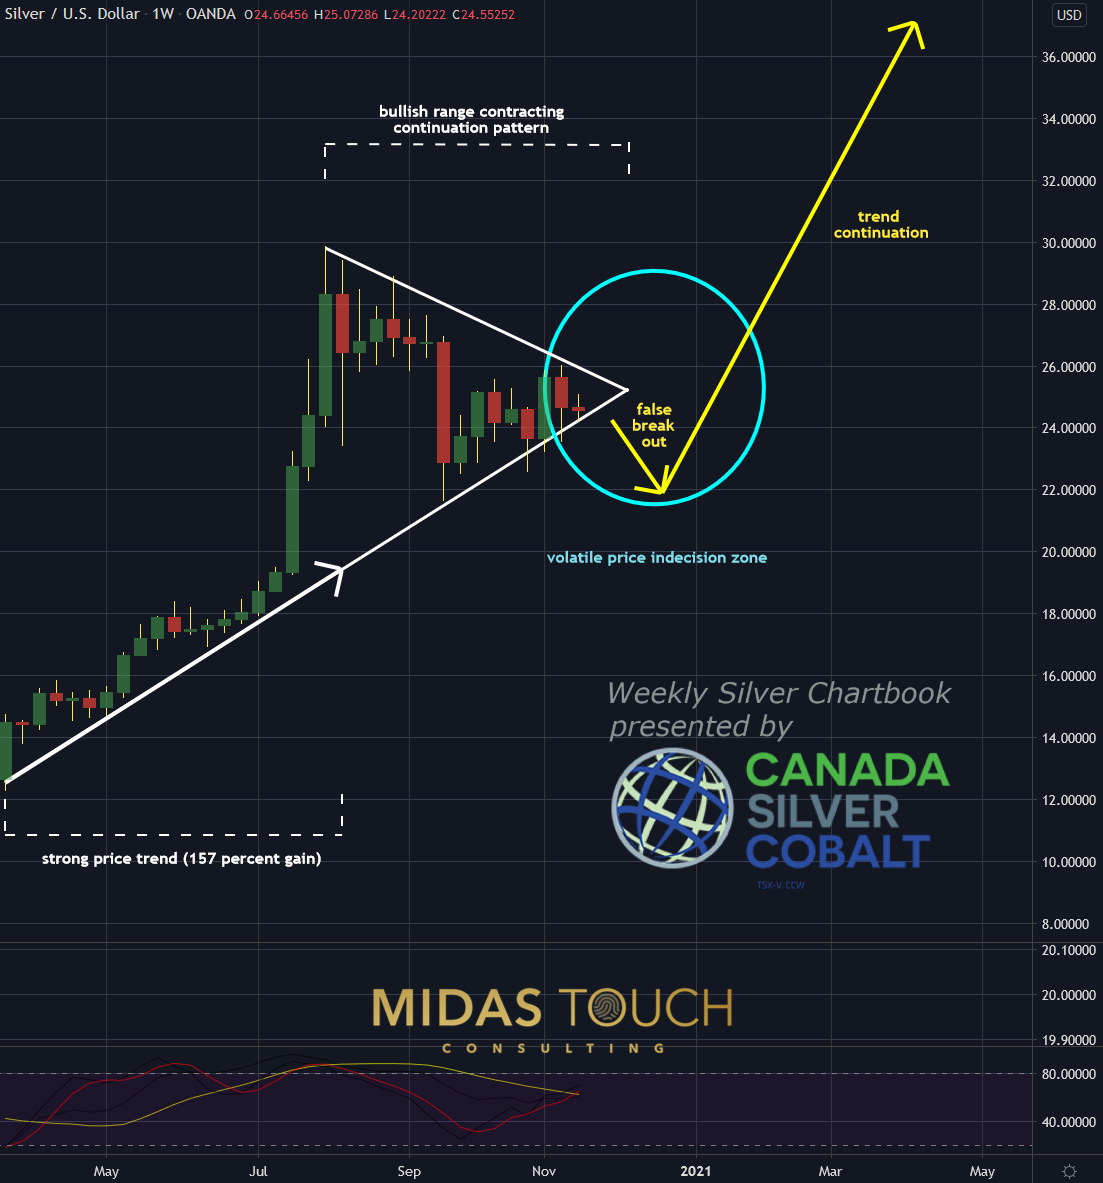
Silver in US Dollar, weekly chart as of November 18th, 2020
Above, you can see a chart from our Silver, Impact Scope . The assumed trend line break has now manifested as anticipated (see below). This has set in motion the possible activation of turbulent times for the Silver market. With a strenuous year for everybody, not just market participants, a quieter holiday season is hoped for by individuals. Nevertheless, with a still unresolved political arena in the US, increasing negative numbers in the pandemic scenario, and an unstable monetary system around the globe, we could easily be in for a surprise.
Silver, Weekly Chart, Early warning signs:
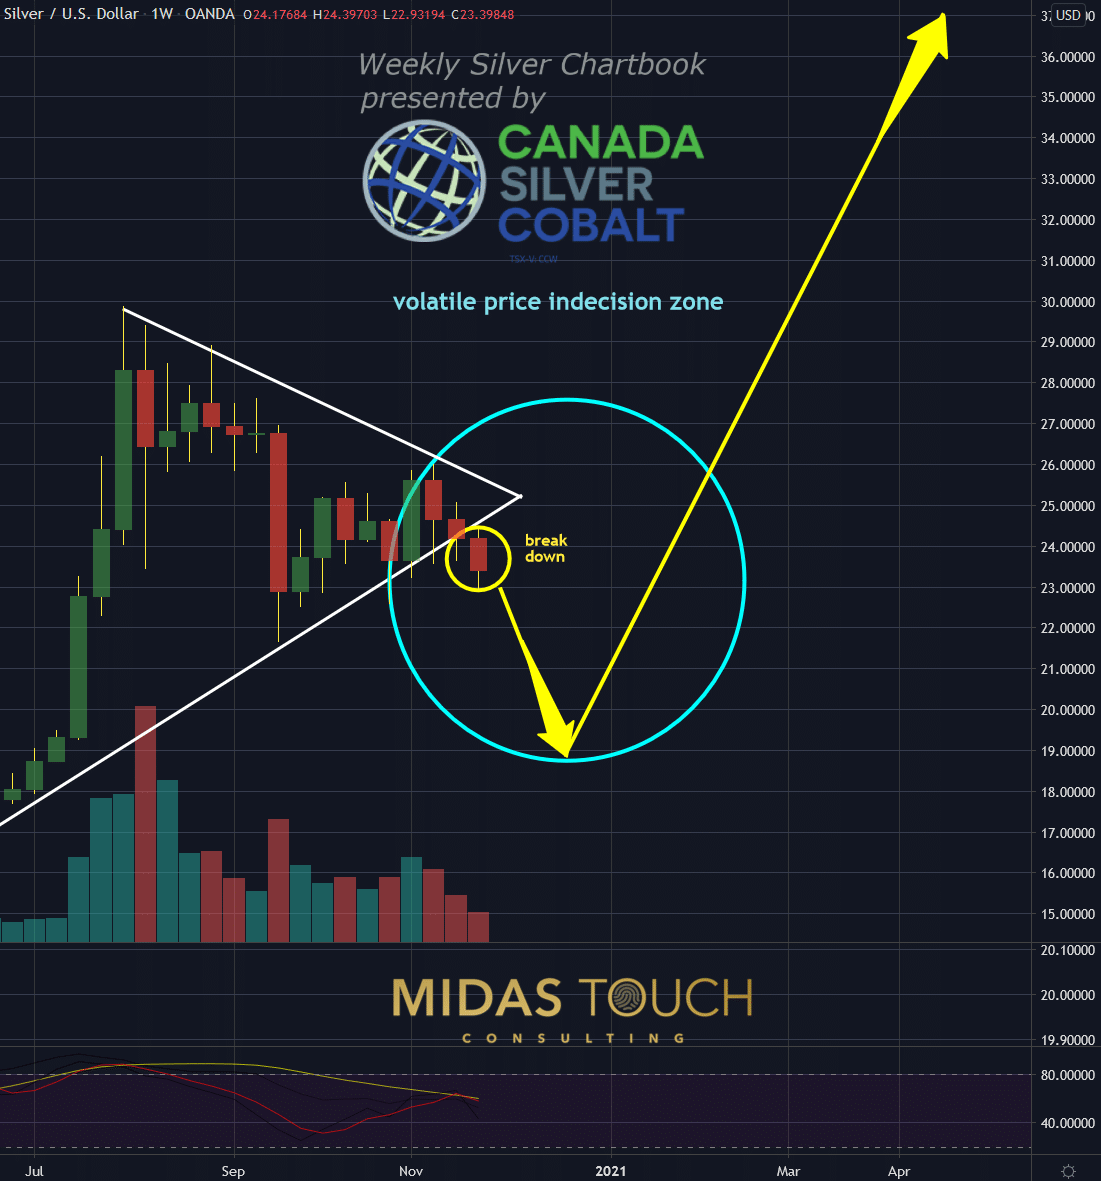
Silver in US Dollar, weekly chart as of November 26th, 2020
With a significant trend line, that held steadily for eight-month since March of this year breaking, Silver has entered into a different arena of price behavior. While this being a conservative support zone to add to your physical holdings of Silver for a multiyear time frame, the weekly trading arena has shifted its consensus. We are now near the low end of a sideways trading range, endangered to break even lower!
Silver, Weekly Chart, Watch out!
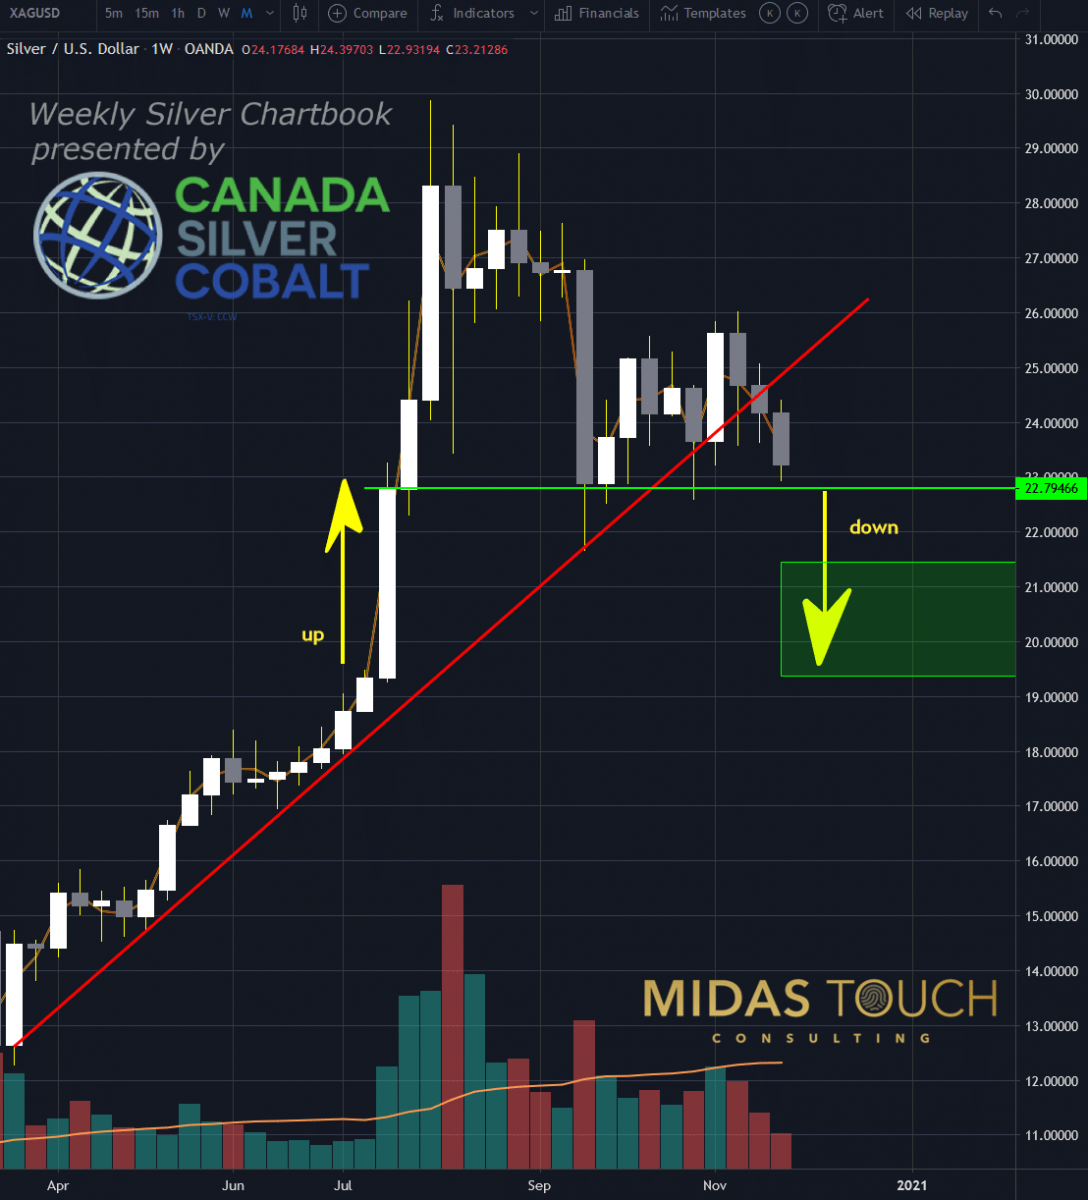
Silver in US Dollar, weekly chart as of November 26th, 2020
It is a dynamic cocktail of expecting quieter times near year-end by market participants, but many news areas are still unresolved. As a result, silver prices could break through the support they are sitting on and then swiftly slide into a compression move down, reversing from the exhaustion up move in the third week of July this year.
Should this scenario pan out, we would expect a swift bounce that requires active market participation to take advantage of an only temporary oversold market.
Timing, the Silver watch
It needs awareness, smart money management, and good timing to stay out of trouble. Meaning it is this “stay out of trouble” approach that is way more important than “how can I make profits”. Therefore, losses are avoided for a smooth equity curve and steady growth.
Playing defensively this time rather than being aggressively allocated. It will be this defensive attitude that will allow redistributing assets in this timing scheme before the dips are happening for each asset class.
Consequently providing powder for reallocation to a different asset class at bottoms. Bottoms, where most are shell shocked if not even broke. Plan your trades and trade your plan. Timing is everything.
********

Outstanding abstract reasoning ability and ability to think creatively and originally has led over the last 25 years to extract new principles and a unique way to view the markets resulting in a multitude of various time frame systems, generating high hit rates and outstanding risk reward ratios. Over 20 years of coaching traders with heart & passion, assessing complex situations, troubleshoot and solve problems principle based has led to experience and a professional history of success. Skilled natural teacher and exceptional developer of talent.Avid learner guided by a plan with ability to suppress ego and empower students to share ideas and best practices and to apply principle-based technical/conceptual knowledge to maximize efficiency. 25+ year execution experience (50.000+ trades executed) Trading multiple personal accounts (long and short-and combinations of the two). Amazing market feel complementing mechanical systems discipline for precise and extreme low risk entries while objectively seeing the whole picture. Ability to notice and separate emotional responses from the decision-making process and to stand outside oneself and one’s concerns about images in order to function in terms of larger objectives. Developed exit strategies that compensate both for maximizing profits and psychological ease to allow for continuous flow throughout the whole trading day. In depth knowledge of money management strategies with the experience of multiple 6 sigma events in various markets (futures, stocks, commodities, currencies, bonds) embedded in extreme low risk statistical probability models with smooth equity curves and extensive risk management as well as extensive disaster risk allow for my natural capacity for risk-taking.
More from Silver Phoenix 500


