S&P500 – Upside In Question…Watch The NASDAQ


The point of reading developing market activity, as seen in charts, is to eliminate any need to “predict” what may develop next day, week, or month. There is no more reliable a source of information than the market itself. Everything one needs to know is found within price and volume activity, over time. If you know the market trend, and you have some solid rules of engagement, profitable success is almost assured.
The stock market has made historic highs, but there are questions regarding its ability to sustain the upward drive during the natural market-aging process. Last time, there was a discussion about rules and a need for caution, [S&P And NAS - Best Offense Is A Good Defense, click on https://www.gold-eagle.com/article/sp500-and-nasdaq-%E2%80%93-best-offense-good-defense , if you missed it].
That has not changed within the question of, in the past week, has the market changed?
The answer has to be yes because there has been more activity, but recognizing how the market has changed did not get any easier. The purpose of first identifying the trend is to be in a position of knowing which trading rules to use as a guide. There are times when clarity is lacking, and it is best to wait for the market to confirm its intent before getting overly committed to the upside, or too defensive on the downside.
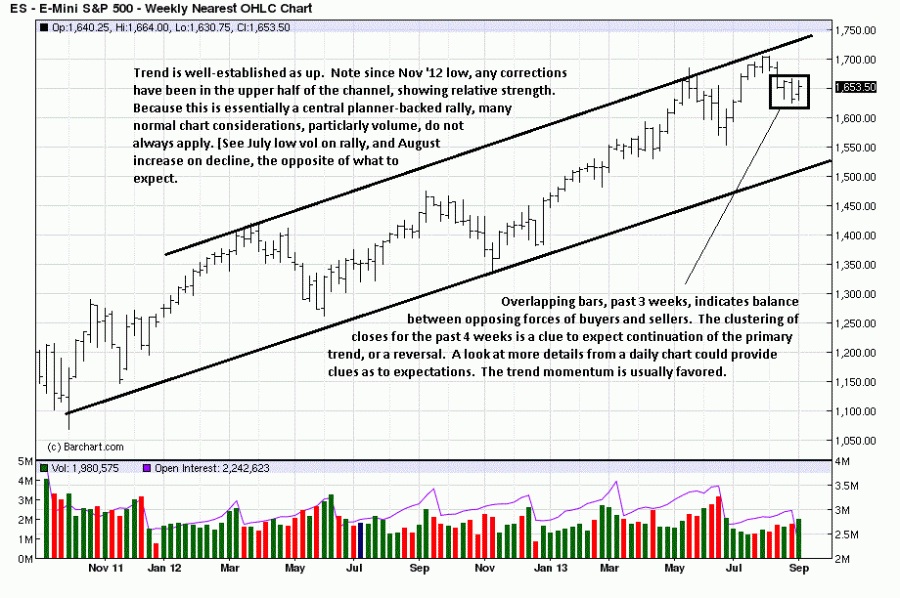
The overall structure of the weekly chart remains positive, and continuation higher should be the norm until there is something more to assess otherwise.
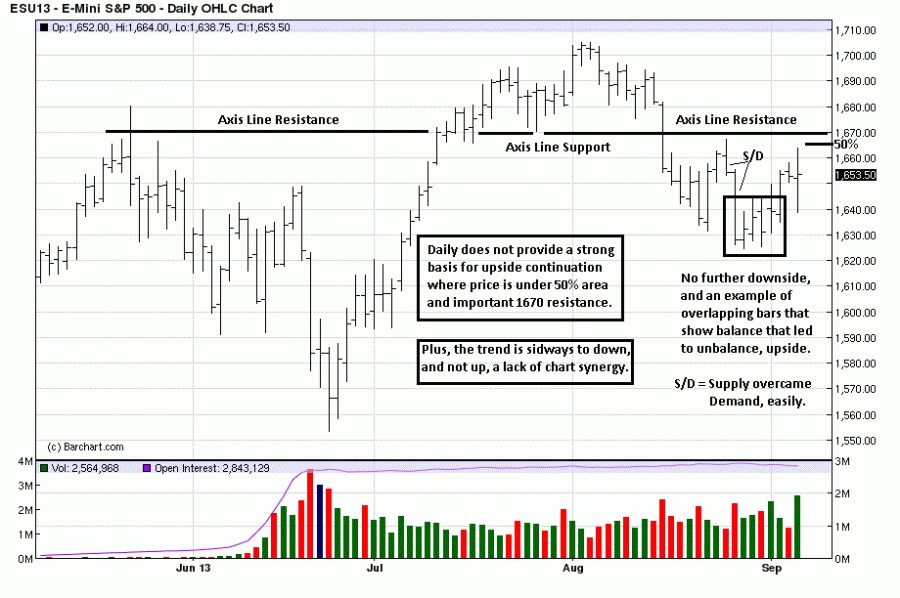
In trending markets, one wants to see synergy of various time frames, but it is not there in this daily chart, relative to the weekly. The daily trend has weakened. As an index, it is a warning for individual stocks that are not showing profits (discussed last week). For those stocks that are profitable, protective stops are still advised.
Friday was an important day for the up-trend to reassert itself here. There was a lot of volatility, and at the end of the day, price was little changed from Thursday’s opposite performance of a very tight range. The close was in the upper half of the bar, a plus, but there needs to be follow-through on Monday because of where recent activity lies… just under 1670 resistance, and also under a 50% range rally from the recent high lot low. A market is considered weak when a rally cannot rise above a half-way correction area. These are negative signs and if not erased by upside activity, the market can correct even further to the downside.
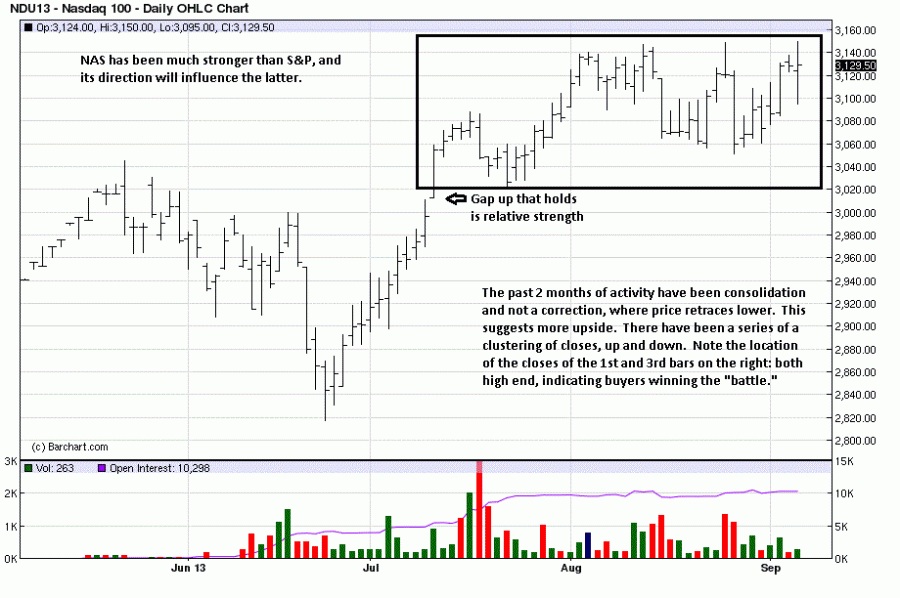
Perhaps the best hope for the S&P500 lies in the stronger tech-oriented market, the NASDAQ. When price gaps up to establish is higher trading level, it is a sign of strength, and that gap has never been challenged. The entire market, since mid-July, has been consolidating and not correcting. The difference is a sign of relative strength, for a correction takes price lower in retracing recent gains from the last swing low.
Taken on its own, the NAS looks higher, and it may be the best barometer for the S&P.
Trade accordingly.
********
Edge Trader Plus


