S&P500 Bulls Are Likely To Get Tested Soon


The S&P 500 closed again above the mid-Feb bearish gap, and the talk of taking on the all-time highs is intensifying. So does the greed that's growing more extreme with each passing day. With the put/call ratio approaching the early June lows, it's getting crowded on the buy side.
Stocks have been enjoying the Q2 earnings reports, brushing aside the stimulus wrangling and job market realities (yes, the federal continuing claims rose again, and combined with the state continuing claims, they're within spitting distance of their early July record total above 32 millions).
The longer the wait for a new package, the more will the reality's repercussions (this goes beyond consumer discretionaries) be reflected in stock prices. Hello second wave of unemployment, where the jobs that came back, are being lost again. Add elections uncertainty or a U.S. – China surprise, and a recipe for a pretty volatile autumn results.
But Trump signed on Saturday the executive orders so as to move past he stalling talks in Congress. Couple that with the Fed support, and the stock rally has more time to run.
Rising Treasuries though reveal a certain degree of distrust in the recovery story, and the precious metals bull front-runs inflation. These boil down to stagflation being baked in the cake.
All right, let's dive in to the charts.
S&P500 in the Short-Run
I’ll start today's flagship Stock Trading Alert with the weekly chart perspective (charts courtesy of http://stockcharts.com ):
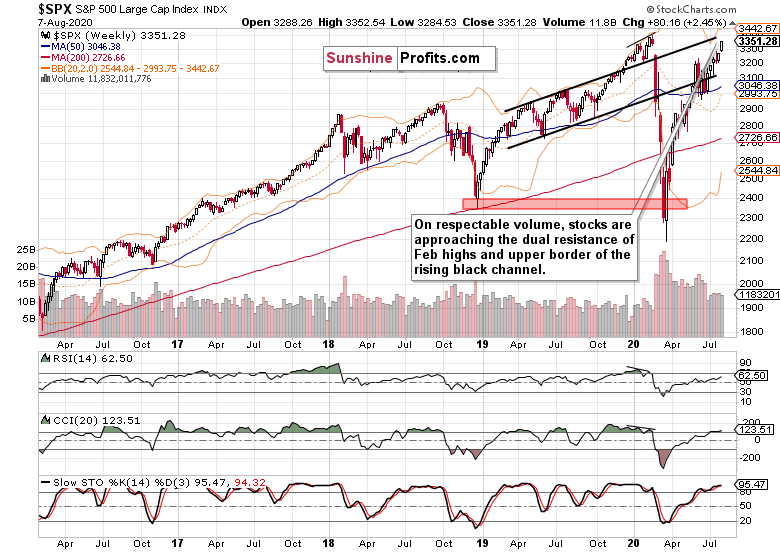
Bullish price action for many recent weeks on volume that isn't yet inviting increasing participation of the sellers. This fact alone bodes well for higher stock prices in the medium-term, but the buyers will meet a set of two key resistances shortly.
It's the Feb all-time highs that are drawing nearer day by day, and the upper border of the rising black trend channel. I look for more emphatically contested encounters there.
On steady volume, the stock upswing goes on (please see this daily chart and many others at my home site). Two attempts to move lower on Friday were rebuffed, and stocks closed at their intraday highs.
Such was my Friday’s short-erm battle plan:
(…) Yes, the daily indicators are increasingly extended, and it's not about the RSI merely. A breather that would coincide with temporarily lower prices, would be both refreshing and healthy for another upleg.
So, we have these days' bullish price action and extended daily indicators as prices are approaching the Feb highs against the stimulus negotiations that are draging on, and many a real economy sector's pain out in the open.
Should a correction strike, and take out the bulls such as myself again profitably out of the open position, it's imperative to assess the downswing's internals, whether it is or isn't turning into something more serious and not merely temporary.
So, have the odds of a correction risen? Credit markets might have the answer.
The Credit Markets’ Point of View
High yield corporate bonds (HYG ETF) declined on Friday, but the volume doesn't tell the story of a reversal. Far from it, the uptrend with generally rising prices and limited intraday volatility hints at the market betting that the Fed has its back. After all, its balance sheet has barely moved till Wednesday, August 5.
That's also why I am not putting much emphasis on the daily bearish engulfing pattern in investment grade corporate bonds (LQD ETF). Let's read that move in the context of preceding days, and that means a daily setback within an uptrend, on not too convincing volume.
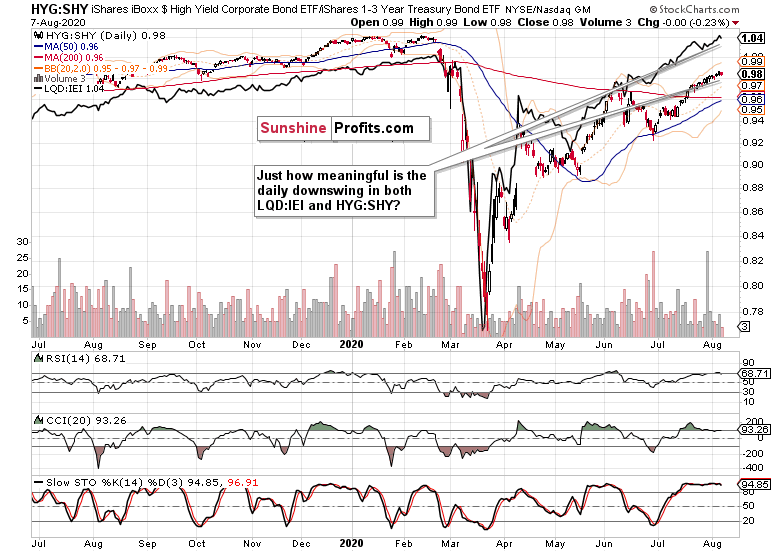
Both leading credit market ratios – high yield corporate bonds to short-term Treasuries (HYG:SHY) and investment grade corporate bonds to longer-dated Treasuries (LQD:IEI) – have moved lower on Friday, because both corporate bond ETFs fell more than the respective Treasuries.
This points to the credit markets turning risk-off, which has the potential to carry over to stocks shouldn't the ratios' decline be a one day phenomenon.
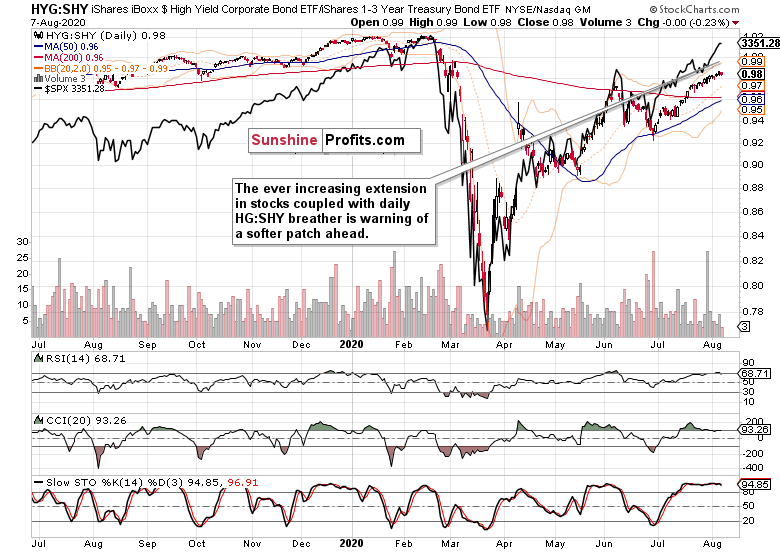
The overlaid S&P 500 closing prices (black line) are getting more and more extended relative to the HYG:SHY ratio. Has the index reached a tipping point where the bears would step in?
The bulls better tread carefully here – as in have the gains locked in, because a bear raid will be an increasingly tempting proposition this week in my opinion.
Would that derail the stock bull run? By the shape of things, I still don't view that as likely. The elections uncertainty or the measured pace of the recovery aren't on the stock market's radar screen featuring prominently just yet.
Smallcaps, Emerging Markets and Copper
So far so good, the S&P 500 upswing was mirrored with the rising Russell 2000 (IWM ETF). The fact there's no distribution, no profit taking in the smallcaps, paints a picture of both U.S. indices' resiliency.
True, the situation in Dow Jones Industrial Average (DIA ETF) isn't as optimistic as the diamonds are trading still below their early June highs, which absolutely doesn't compare to the stellar performance of Nasdaq ($COMPQ).
Still, the non-confirmations can drag on for months, and be resolved at much higher prices. The key takeaway is that there hasn't been an immediate deterioration.
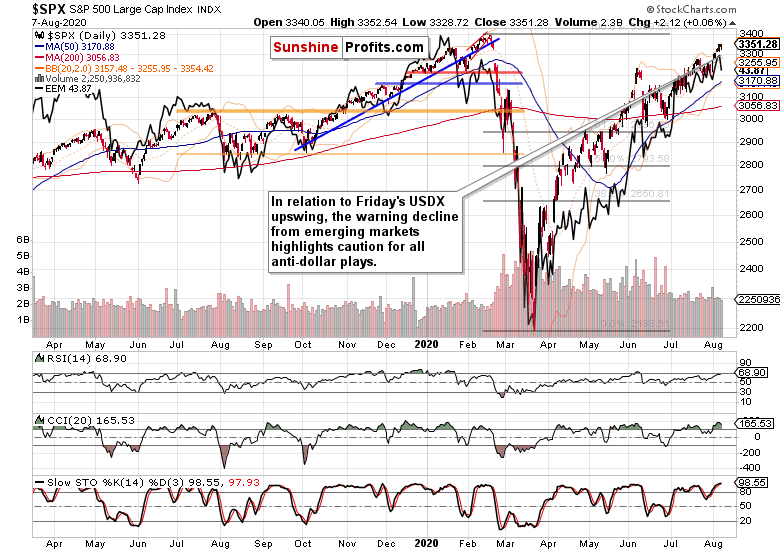
The same thing though can't be said about emerging markets (EEM ETF), because they've turned sharply lower – hand in hand with the dollar upswing. In my Friday’s gold analysis, I've called for the greenback to put up a fight now, and non-U.S. stocks are feeling the heat.
Such a flight to safety has the potential to spill over into the States – the longer it last, naturally. And just as one swallow doesn't make a spring, Friday's EEM move means amber light for stock bulls.
The red metal ($COPPER) seconds that cautious conclusion as it had declined on heavy volume. Such a move has the potential to exert downward influence on the S&P 500 down the road.
S&P 500 Market Breadth
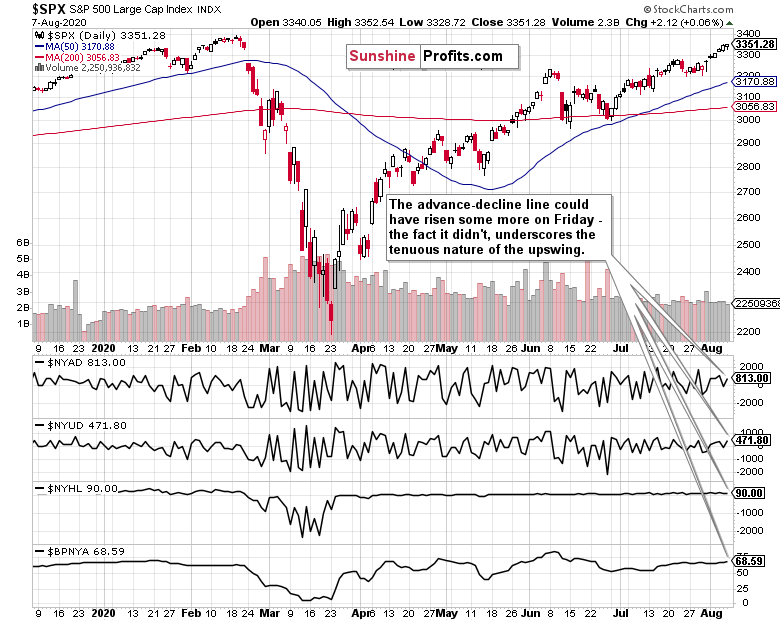
Given the S&P500 upswing, the advance-decline line could have risen some more on Friday, and the fact it didn't, raises the possibility of a short-term setback. We might be looking at a very short-term divergence in the making (lower high in the indicator), but that would require a down-to-sideways trading to hit at this week's open.
Overall, the market breadth chart calls for short-term caution as well. The bulls enjoy the benefit of the doubt, but it's likely we're slowly but surely entering a period of not so smooth sailing ahead. Will the monetary and fiscal policy duo invalidate that?
Summary
Summing up, the S&P 500 upswing goes on, but many signs call for short-term caution as a soft patch in stocks might be not too far ahead. With the dollar likely to move higher in the short run, the risk-off echo could throw a spanner into the stock bulls' works. Time to dance close to the exit door should the bulls start running out of breath – every bull market has to endure corrections and the current one is no exception.
Thank you for reading today’s free analysis. I encourage you to sign up for our daily newsletter - it's absolutely free and if you don't like it, you can unsubscribe with just 2 clicks. If you sign up today, you'll also get 7 days of free access to the premium daily Stock Trading Alerts as well as our other Alerts. Sign up for the free newsletter today!
Monica Kingsley
Stock Trading Strategist
Sunshine Profits: Analysis. Care. Profits.
* * * * *
All essays, research and information found above represent analyses and opinions of Monica Kingsley and Sunshine Profits' associates only. As such, it may prove wrong and be subject to change without notice. Opinions and analyses were based on data available to authors of respective essays at the time of writing. Although the information provided above is based on careful research and sources that are believed to be accurate, Monica Kingsley and her associates do not guarantee the accuracy or thoroughness of the data or information reported. The opinions published above are neither an offer nor a recommendation to purchase or sell any securities. Ms. Kingsley is not a Registered Securities Advisor. By reading Monica Kingsley’s reports you fully agree that she will not be held responsible or liable for any decisions you make regarding any information provided in these reports. Investing, trading and speculation in any financial markets may involve high risk of loss. Monica Kingsley, Sunshine Profits' employees and affiliates as well as members of their families may have a short or long position in any securities, including those mentioned in any of the reports or essays, and may make additional purchases and/or sales of those securities without notice.
********

Monica Kingsley is a trader and financial markets analyst. Checking dozens of charts daily, she integrates their messages with economics and in-depth experience. Trade calls and writing are her cup of tea as much as studies in market histories. Having been at the financial markets when the Great Recession arrived, she experienced many bull and bear markets - be it in stocks, bonds, gold and silver. https://www.monicakingsley.co
More from Silver Phoenix 500


