S&P500 Nearing Previous Highs…What’s Next?


Wednesday’s trading session didn’t change much. Stocks extended their short-term consolidation following Monday’s rebound off a support level. The S&P 500 index continues to trade within a four-week-long consolidation after the early August decline. Was Monday’s advance an upward reversal or just upward correction before another leg down?
The U.S. stock market indexes gained 0.4-1.0% on Wednesday, as they retraced their Tuesday’s decline. The S&P500 Index got back to the short-term local lows on Friday and then it bounced off that support level. The broad stock market’s gauge is now 4.7% below July the 26th record high of 3,027.98. The Dow Jones Industrial Average gained 1.0% and the Nasdaq Composite gained 0.4% on Wednesday.
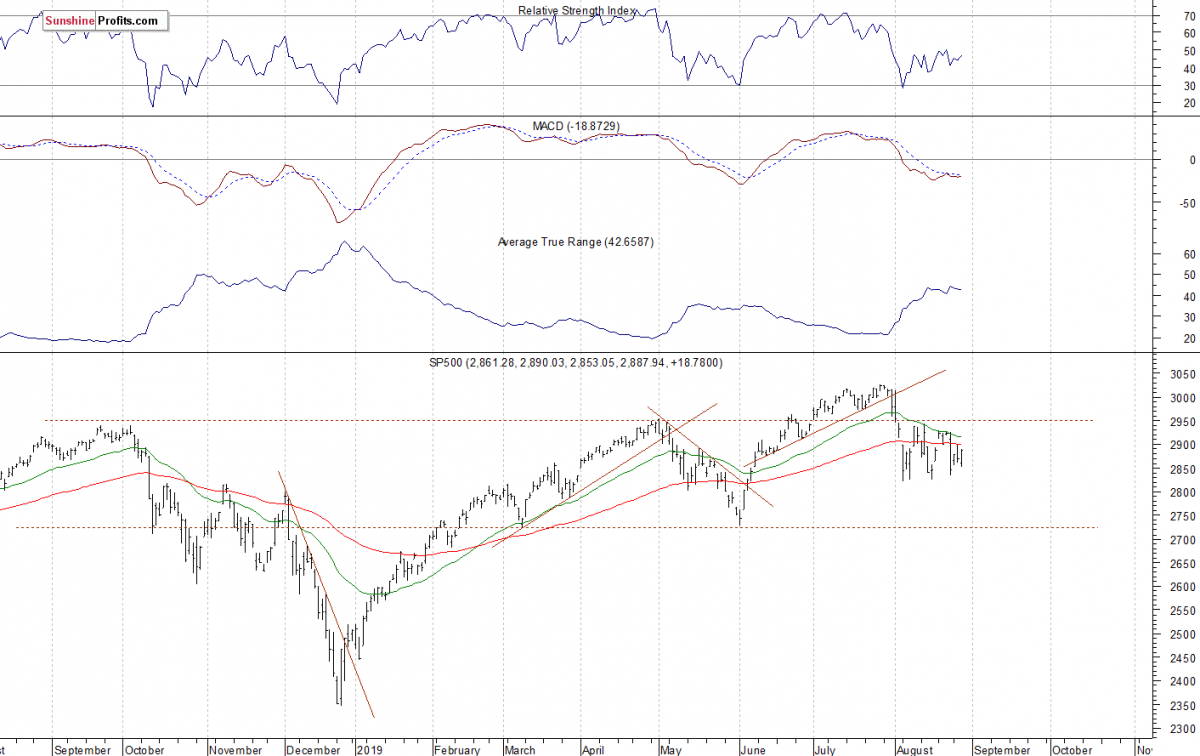
The nearest important resistance level of the S&P 500 index is at 2,900-2,920, marked by the recent local highs. On the other hand, the support level is at 2,850-2,860. The next support level is at 2,820-2,825, marked by the previous lows.
The broad stock market broke below its two-month-long upward trend line in early August, and then it quickly retraced most of the June-July advance. The S&P 500 index continues to trade within a consolidation following early August decline:
Positive Expectations, Upward Reversal?
The index futures contracts trade 1.1-1.3% above their Wednesday’s closing prices. So expectations before the opening of today’s trading session are bullish. The European stock market indexes have gained 1.1-1.5% so far. Investors will wait for some economic data releases this morning: Preliminary GDP number, Unemployment Claims at 8:20 a.m., Pending Home Sales at 10:00 p.m.
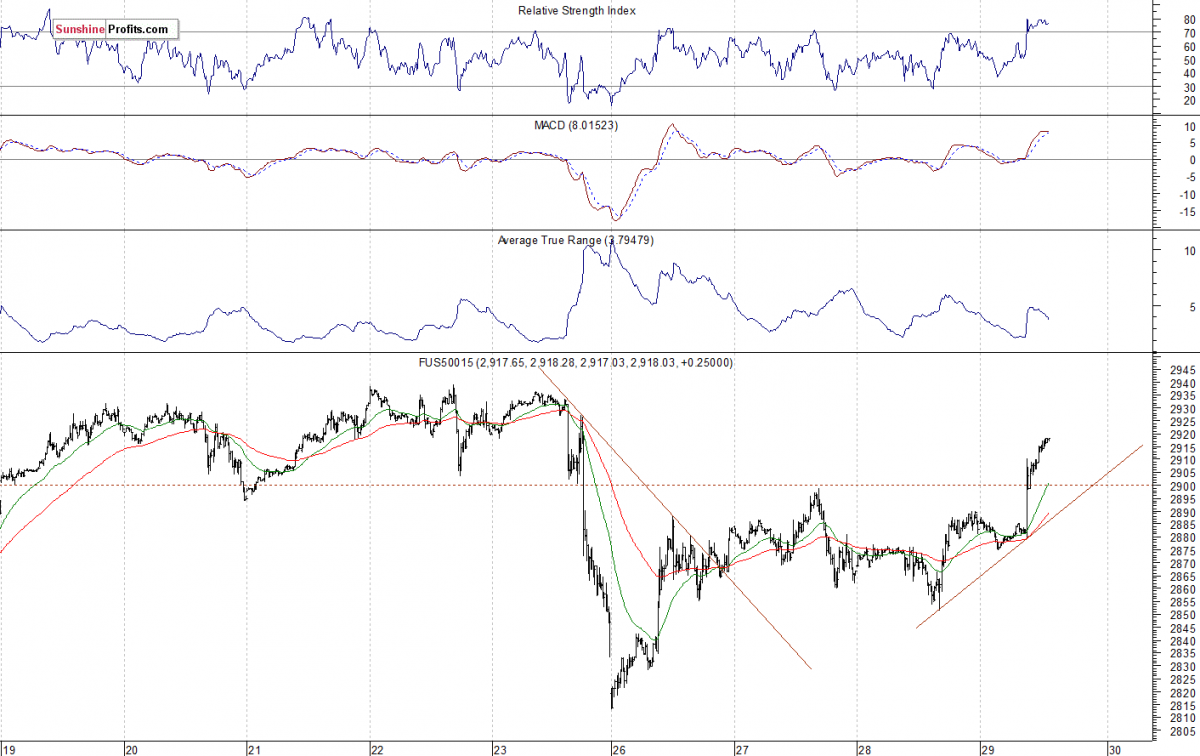
The S&P 500 futures contract trades within an intraday uptrend, as it extends its overnight breakout above the recent local highs. The nearest important resistance level is now at 2.920-2,940. On the other hand, the support level is at 2,880-2,900. The futures contract is back within its last week’s consolidation, as we can see on the 15-minute chart:
Nasdaq 100 Also Higher
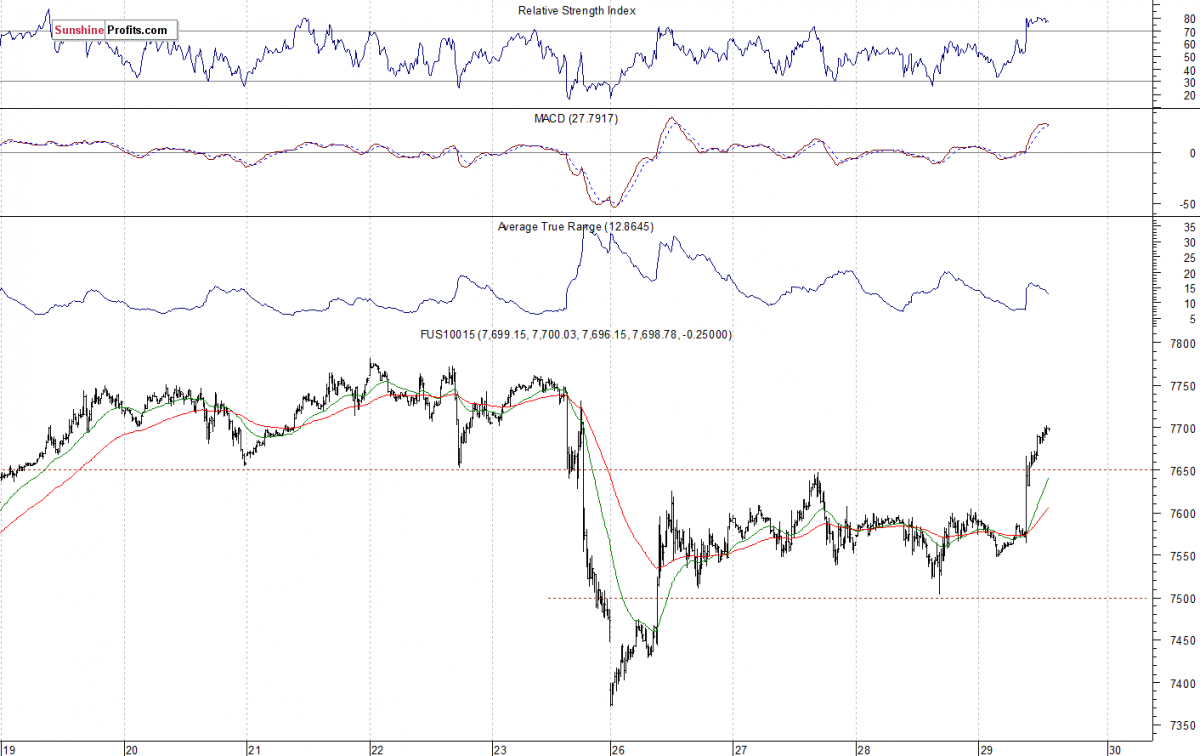
The technology Nasdaq 100 futures contract follows a similar path, as it trades within an intraday uptrend. It bounced off a support level of 7,350-7,400 recently. And this morning it broke above the resistance level of 7,600-7,650. The Nasdaq futures contract is the highest since last Friday, as the 15-minute chart shows:
Big Cap Tech Stocks – Still No Clear Direction
Let's take a look at the Apple, Inc. stock (AAPL) daily chart (chart courtesy of http://stockcharts.com). The stock sharply reversed its recent upward course on Friday, as it fell closer to the $200 price again. On Monday it bounced off that support level. The market may extend volatile fluctuations following the early August breakdown below its two-month-long upward trend line:

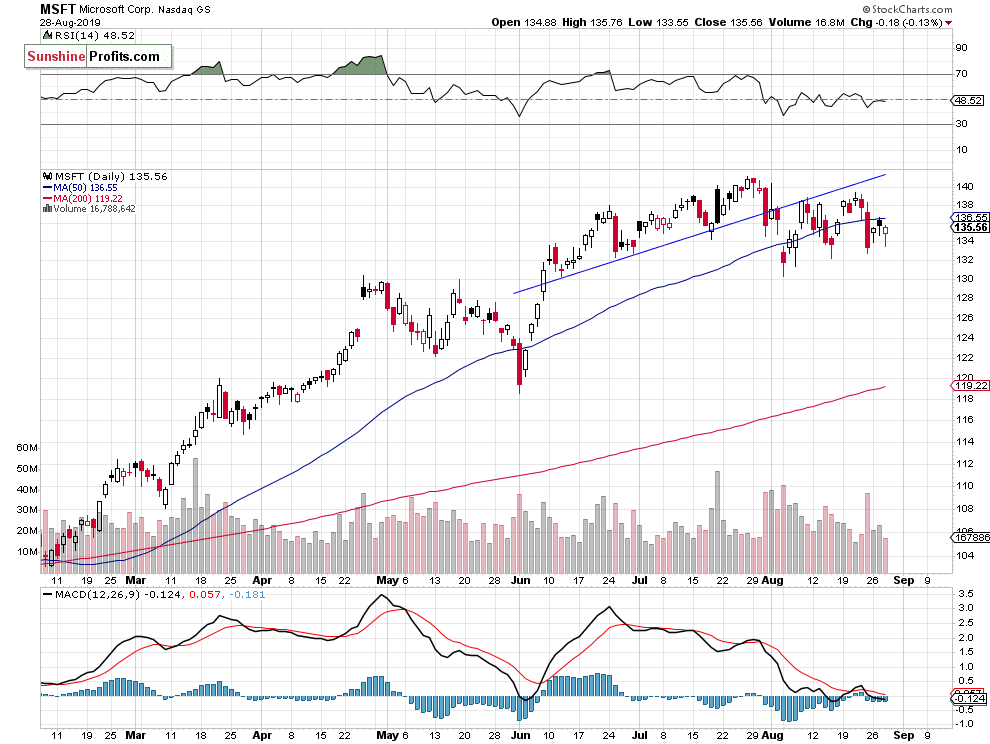
Now let's take a look at the daily chart of Microsoft Corp. stock (MSFT). The stock retraced most of its recent advance on Friday, as it fell to a support level of $130-135 again. It still looks like a consolidation within a medium-term uptrend:
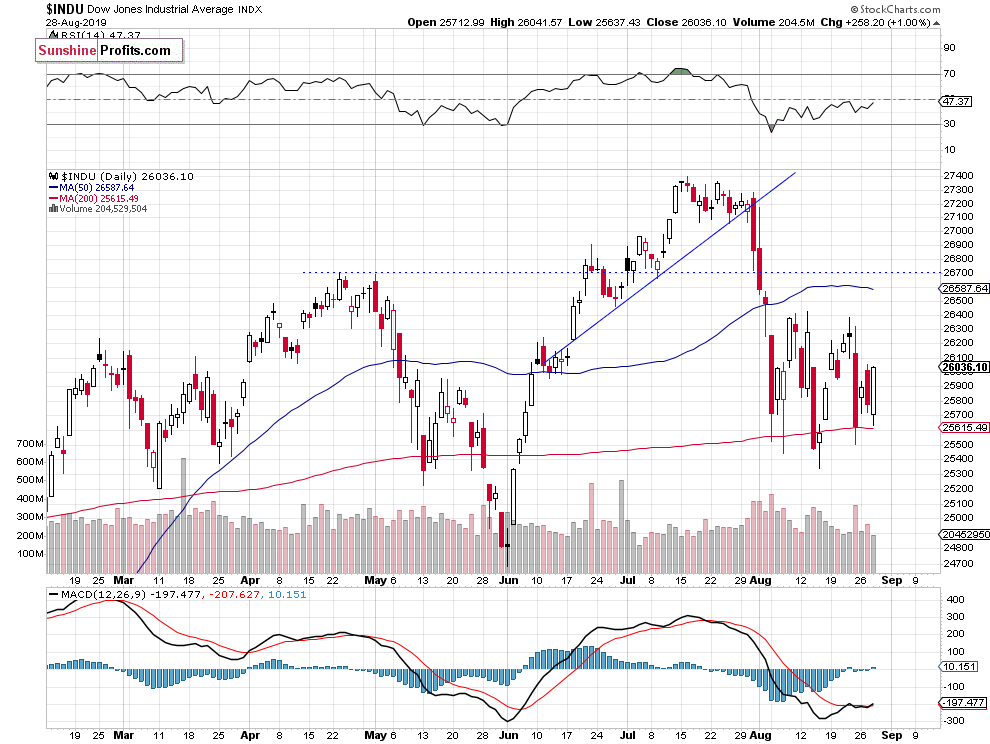
Dow Jones Above 26,000 Again
The DJIA broke below its upward trend line in late July. Then it fell to around 25,500, before bouncing off the 200-day moving average. It kept bouncing off that support level recently. On Friday the Dow fell to its average, but then it bounced towards the 26,000 level again:
The S&P 500 index broke below the upward trend line in late July, as investors reacted to the Fed’s Rate Decision release, among other factors. We saw technical overbought conditions along with negative technical divergences then. And the market declined following renewed trade war fears. Recently it has been rebounding off a support level of around 2,800-2,820. On Friday it reached that support level again. Today we may see a breakout above the short-term local highs. There will likely be another attempt at breaking above this month’s local highs.
Concluding, the S&P 500 index will likely open higher today. The market may get close to the recent local highs again. However, we may see some more sideways trading action there.
If you enjoyed the above analysis and would like to receive daily premium follow-ups, we encourage you to sign up for our Stock Trading Alerts to also benefit from the trading action we describe. Check more of our free articles on our website, including this one – just drop by and have a look. We encourage you to sign up for our daily newsletter, too - it's free and if you don't like it, you can unsubscribe with just 2 clicks. If you sign up today, you'll also get 7 days of free access to our premium daily Gold & Silver Trading Alerts. Sign up for the free newsletter today!
Paul Rejczak
Stock Trading Strategist
Sunshine Profits - Effective Investments through Diligence and Care
* * * * *
Disclaimer
All essays, research and information found above represent analyses and opinions of Paul Rejczak and Sunshine Profits' associates only. As such, it may prove wrong and be a subject to change without notice. Opinions and analyses were based on data available to authors of respective essays at the time of writing. Although the information provided above is based on careful research and sources that are believed to be accurate, Paul Rejczak and his associates do not guarantee the accuracy or thoroughness of the data or information reported. The opinions published above are neither an offer nor a recommendation to purchase or sell any securities. Mr. Rejczak is not a Registered Securities Advisor. By reading Paul Rejczak’s reports you fully agree that he will not be held responsible or liable for any decisions you make regarding any information provided in these reports. Investing, trading and speculation in any financial markets may involve high risk of loss. Paul Rejczak, Sunshine Profits' employees and affiliates as well as members of their families may have a short or long position in any securities, including those mentioned in any of the reports or essays, and may make additional purchases and/or sales of those securities without notice.
********
More from Silver Phoenix 500


