The S&P500 Ride Ahead – Rocky Or Not So Rocky?


Supported by another strong ADP non-farm payrolls, the S&P 500 extended its premarket rally on Friday, but it quickly ran out of steam. How concerning is seeing most of its intraday gains gone? That's actually not the only sign of short-term non-confirmation. Should the bulls be getting concerned here?
There are still more factors going for this rally than against it. In today's analysis, I will present these together with the non-confirmation signs.
Credit markets are still on the upturn, stocks are undaunted by the rising U.S. Covid-19 cases and hits to reopening plans across many states.
This dynamic is still at play, and I think the bullish bias to the S&P 500 outlook will deal with the above-mentioned signs of caution in a relatively short order.
S&P 500 in the Medium- and Short-Run
I’ll start today's flagship Stock Trading Alert with the weekly chart perspective (charts courtesy of http://stockcharts.com ):
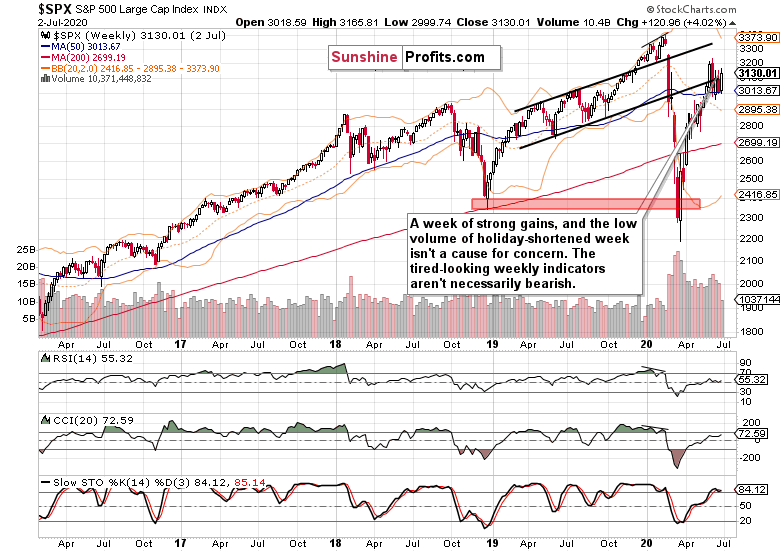
Last week, the S&P500 rebounded off the 50-week moving average, and closed not too far from the weekly highs. Yet, Friday's attempt to overcome previous two weeks' intraday tops, was rejected. So far rejected.
While the weekly indicators appear tired, that wouldn't be a concern for the stock upswing to continue. The volume doesn't raise red flags either – had Friday not been a bank holiday, the weekly volume would be more than adequate with its average daily addition. But it must be said that the weekly chart is bullish-to-neutral in its implications.
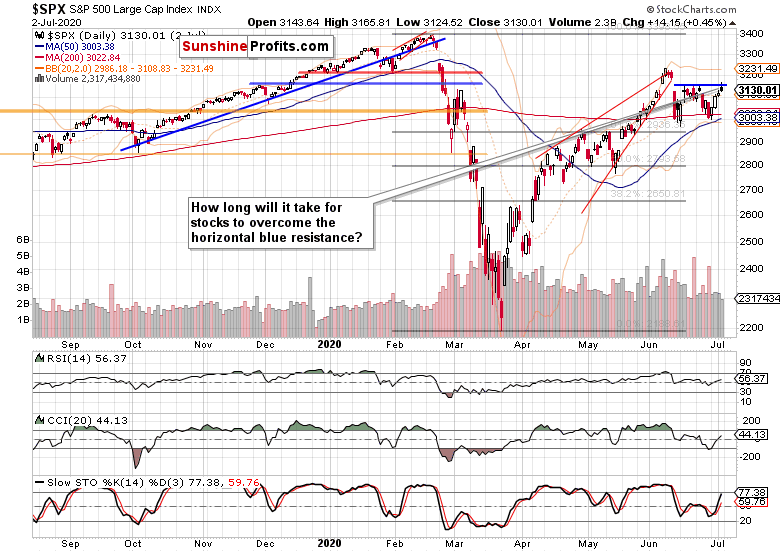
The daily chart shows that the bulls were again rejected on Friday at the blue horizontal resistance line. Still, I would not consider the latest candle as one characterizing a reversal – and not only because of the lower volume. The daily indicators favor the upswing to continue, short-term breather to come or not.
Let's move to the credit markets next.
The Credit Markets’ Point of View
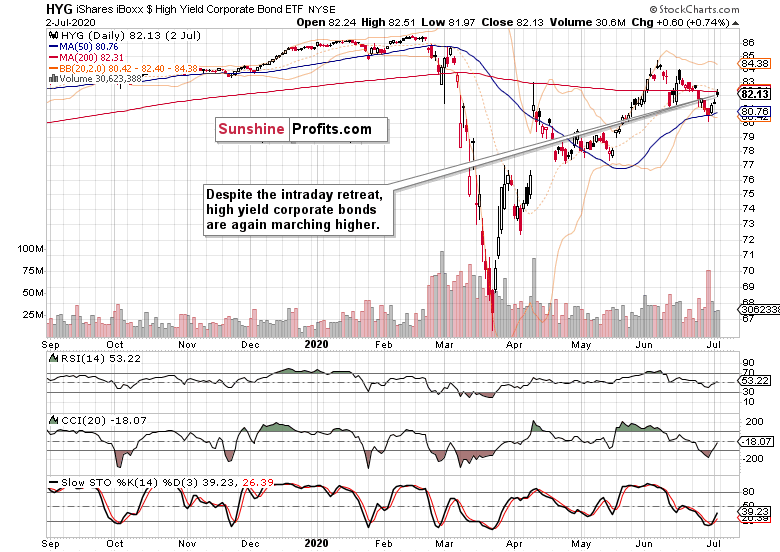
Friday's candle in high yield corporate bonds (HYG ETF) mirrored the S&P 500 one, and hints at a daily consolidation - yes, more gains will come down the road, and power stocks higher.
Risk is coming back into the market place – slowly but surely. And it's not just about the PHB:$DJCB (high yield corporate bonds to all bonds) ratio's fledgling uptick from the late June local bottom.
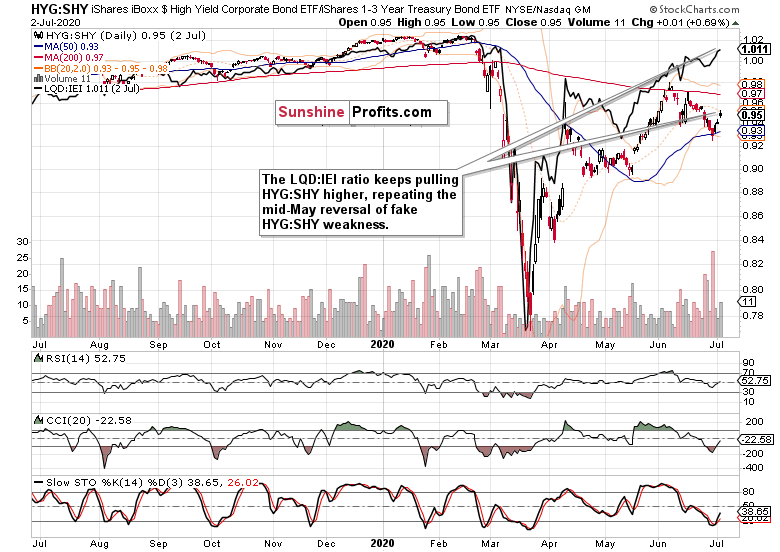
As the above chart shows, investment grade corporate bonds to the longer-term Treasuries (LQD:IEI) are helping the high yield corporate bonds to short-term Treasuries (HYG:SHY) ratio to move higher, and much more still appears to come for both metrics.
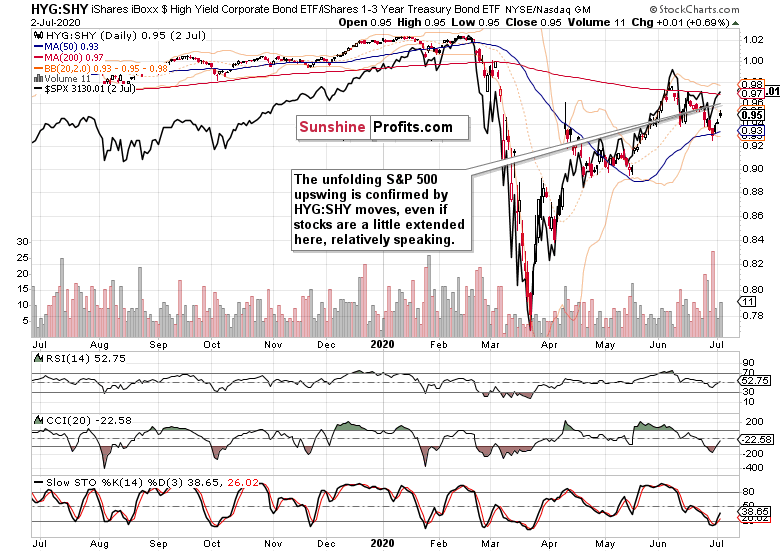
The HYG:SHY ratio supports the stock upswing, but with the S&P 500 at late June highs while the ratio isn't there yet, stocks are a bit extended here. While the charts don't favor a reversal, a sideways consolidation for a few days wouldn't be all too surprising – especially should the credit markets stall.
S&P 500 Market Breadth, Volatility and Other Clues in Focus
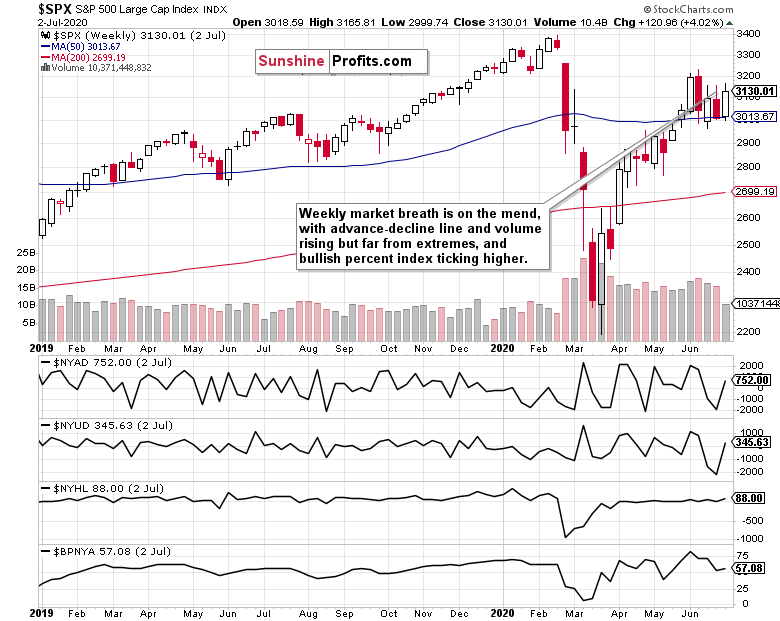
Both the advance-decline line and the advance-decline volume are moving increasingly positively for the bulls – and they have ample scope for moving higher. Bullish percent index has remained in bullish territory, and is curling higher again. In short, market breadth indicators are improving with a solid potential for more constructive action.
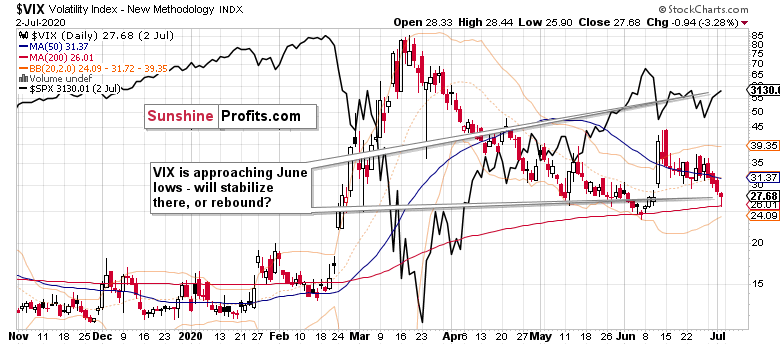
The favorite volatility metric, the VIX, erased much of its Friday's decline. Is it stabilizing around the June lows, or preparing for a rebound? The stabilization scenario appears more probable.
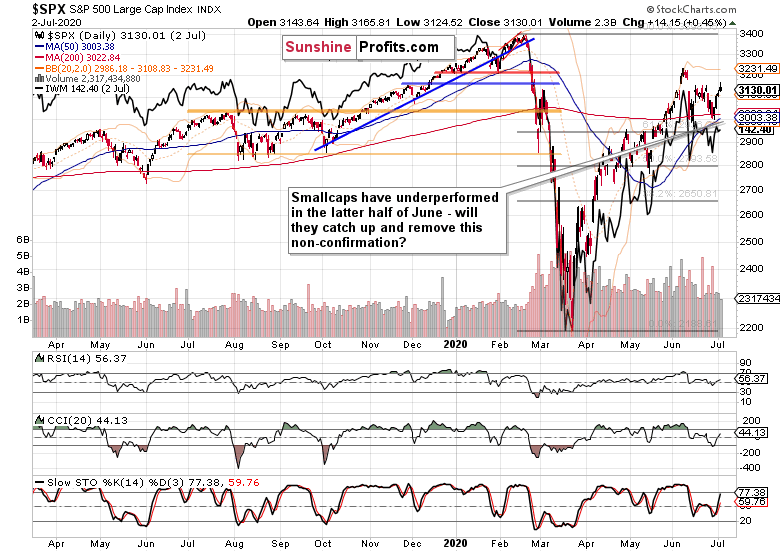
Smallcaps have suffered two daily setbacks, and continue lagging behind the S&P 500. That's especially visible in the latter half of June, right after their failed breakout above their 200-day moving average. While the S&P 500 is trading comfortably above it (i.e. support held and thus upswing continuation is more likely), the Russell 2000 (IWM ETF) isn't yet. Positive resolution to this non-confirmation would certainly lift the outlook – and I think it's a question of time merely.
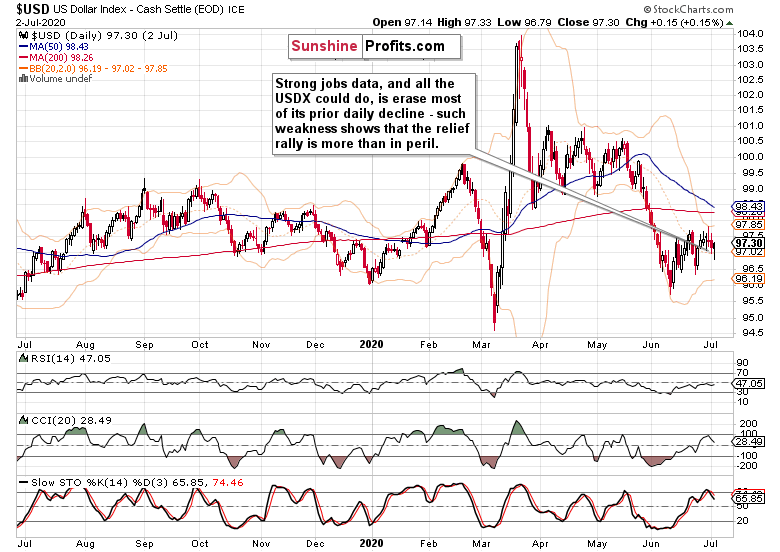
The USD Index also paints a rather bullish picture for the coming week(s), and the caption says it all. The greenback won't be standing in the way of a more risk-on environment.
On Thursday, I added these thoughts on the dollar:
(…) Wouldn't you expect a more veracious move on new U.S. daily corona cases highs? Yeah, cases… That's it.
Key S&P500 Sectors and Ratios in Focus
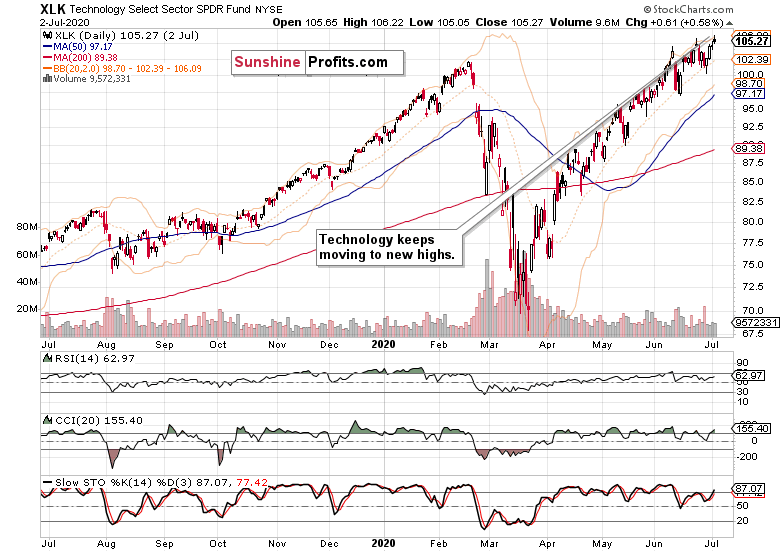
Technology (XLK ETF) is again moving to new highs, and that's positive for the whole index. Yet, the following semiconductors chart shows that there's something amiss with the strength here (just like with the Russell 2000 message).
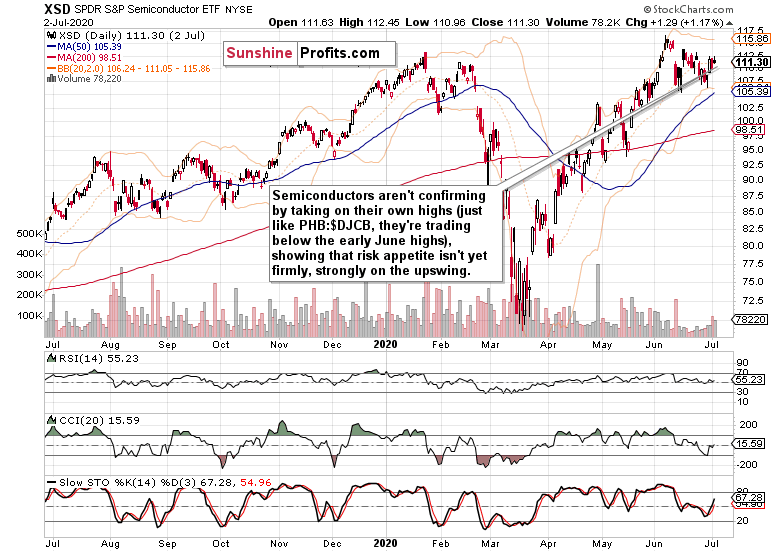
Semiconductors (XSD ETF) are lagging behind, also revealing that we're not in a raging risk-on environment yet. That's also the takeaway from the junk corporate bonds to all corporate bonds (PHB:$DJCB) ratio.
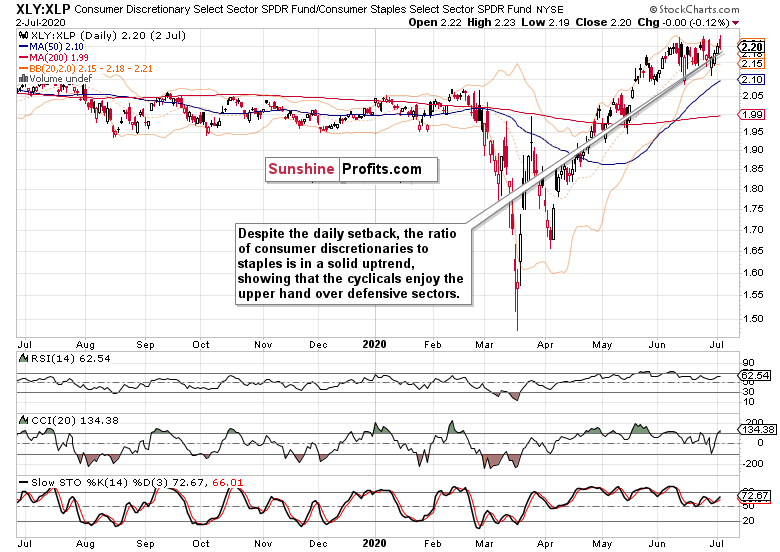
The consumer dicretionaries to consumer staples (XLY:XLP) ratio shows that the cyclicals (such as discretionaries or materials) are doing fine. Baltic Dry Index ($BDI) is also rising while the defensive sectors (utilities and staples) aren't at their strongest. That's a subtle hint that the bullish environment for stocks is intact.
Summary
Summing up, given Friday's non-farm payrolls, the S&P5000 gains could have been bigger, but the index is still taking time to overcome its late June local tops. Signs are though mostly arrayed behind the bulls, and the credit markets support the unfolding stock upswing. The non-confirmation in Russell 2000 or semiconductors underperforming technology will likely get resolved over the coming days or weeks as we see more rotation into cyclical and riskier plays.
The greenback isn't likely to get in the way of further stock gains, and I expect it to rather weaken as the recovery narrative gains more traction – and if you look at emerging market stocks, they've done better over the June consolidation than their U.S. counterparts. Encouragingly, their Friday's upswing has already overcome its early June highs – their outperformance means more gains for the U.S. stock indices as they explode higher again.
I encourage you to sign up for our daily newsletter - it's free and if you don't like it, you can unsubscribe with just 2 clicks. If you sign up today, you'll also get 7 days of free access to the premium daily Stock Trading Alerts as well as our other Alerts. Sign up for the free newsletter today!
Monica Kingsley
Stock Trading Strategist
Sunshine Profits: Analysis. Care. Profits.
* * * * *
All essays, research and information found above represent analyses and opinions of Monica Kingsley and Sunshine Profits' associates only. As such, it may prove wrong and be subject to change without notice. Opinions and analyses were based on data available to authors of respective essays at the time of writing. Although the information provided above is based on careful research and sources that are believed to be accurate, Monica Kingsley and her associates do not guarantee the accuracy or thoroughness of the data or information reported. The opinions published above are neither an offer nor a recommendation to purchase or sell any securities. Ms. Kingsley is not a Registered Securities Advisor. By reading Monica Kingsley’s reports you fully agree that she will not be held responsible or liable for any decisions you make regarding any information provided in these reports. Investing, trading and speculation in any financial markets may involve high risk of loss. Monica Kingsley, Sunshine Profits' employees and affiliates as well as members of their families may have a short or long position in any securities, including those mentioned in any of the reports or essays, and may make additional purchases and/or sales of those securities without notice.
*********

Monica Kingsley is a trader and financial markets analyst. Checking dozens of charts daily, she integrates their messages with economics and in-depth experience. Trade calls and writing are her cup of tea as much as studies in market histories. Having been at the financial markets when the Great Recession arrived, she experienced many bull and bear markets - be it in stocks, bonds, gold and silver. https://www.monicakingsley.co
More from Silver Phoenix 500


