Is the Stock Selloff Over Now?


Some would call yesterday’s session Black Monday. Little wonder as the S&P 500 finished down more than 100 points from Friday’s closing bell. The overnight recovery in the futures gave up most of its gains, and stocks are again hanging close to yesterday’s closing prices. How close to the end in this correction are we?
Regardless of the week being very much in progress, let’s check yesterday’s price action in the weekly chart’s context (charts courtesy of http://stockcharts.com).
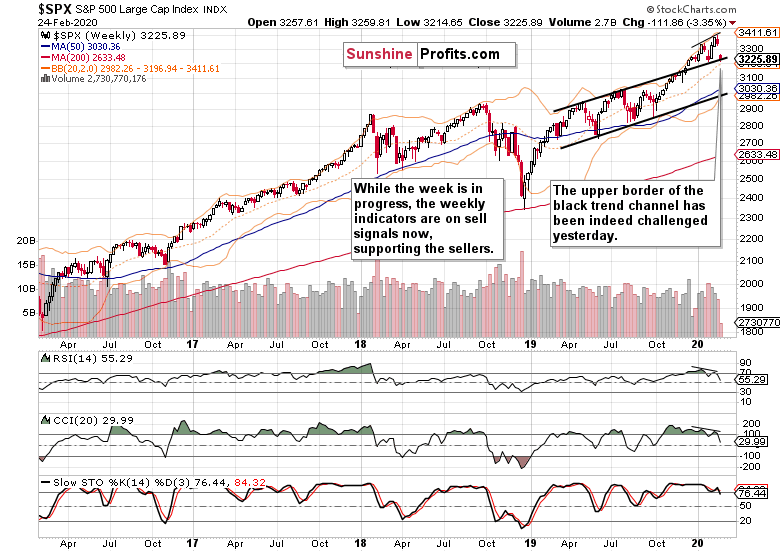
Yesterday’s slide turned the weekly indicators on their sell signals. Unless the bulls lift prices and seriously attempt to close this week’s sizable bearish gap, the indicators will continue to support the bears.
This is what a resolution to the preceding divergencies looks like. Let’s quote our Is This What Falling Through The Floor Looks Like In Stocks? , when we discussed the comparison between:
(…) the levels of both of these indicators with the price action. Stocks have been rising while both the RSI and CCI made lower highs. You can see it marked on the above chart with thin black lines. We have two divergences here – in other words, they didn’t confirm the price advance.
Now, let’s see yesterday’s session playing out on the daily chart.
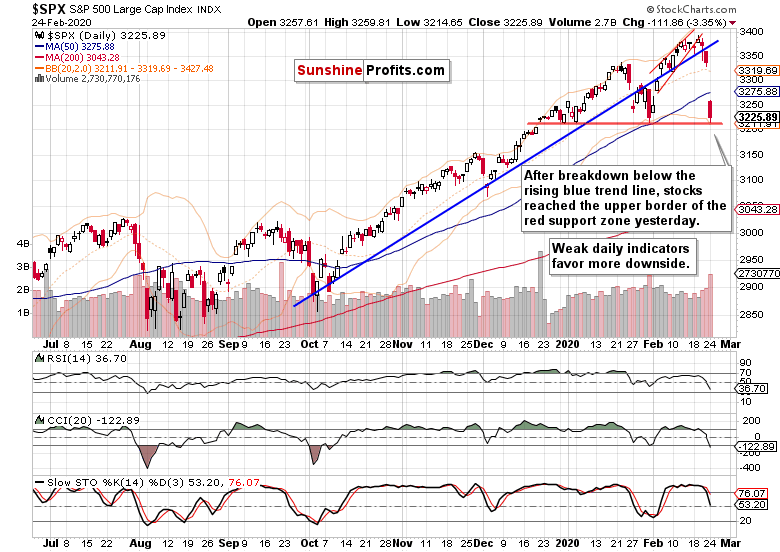
The large bearish gap is impossible not to notice. The bearish factors discussed in our Alerts both on Friday and Monday, played out with vengeance. The downside momentum continued throughout yesterday’s session, yet the upper border of the red support zone withstood the selling pressure. Still, stocks closed relatively near to their intraday lows.
That’s a strong sign that the bulls haven’t really stepped in with enthusiasm during yesterday’s trading hours, which means that one more downswing as a minimum remains likely.
This fact isn’t changed by the overnight futures rally up to 3260. At the moment of writing these words, they change hands at around 3240 as uncertainty regarding the evolving coronavirus spead and impact grips the market place.
It’s practically a foregone conclusion that today’s close will bring us confirmation of the breakdown below the blue trend line. Coupled with the daily indicators’ sell signals, it favors more downside.
Let’s again turn to our yesterday’s alert where we mentioned that:
(…) throughout the February advance, the daily indicators have been slowly losing breath, and not confirming higher prices – in other words, they’ve been diverging just like the weekly indicators.
And how do the market breadth indicators look like after yesterday’s slide?
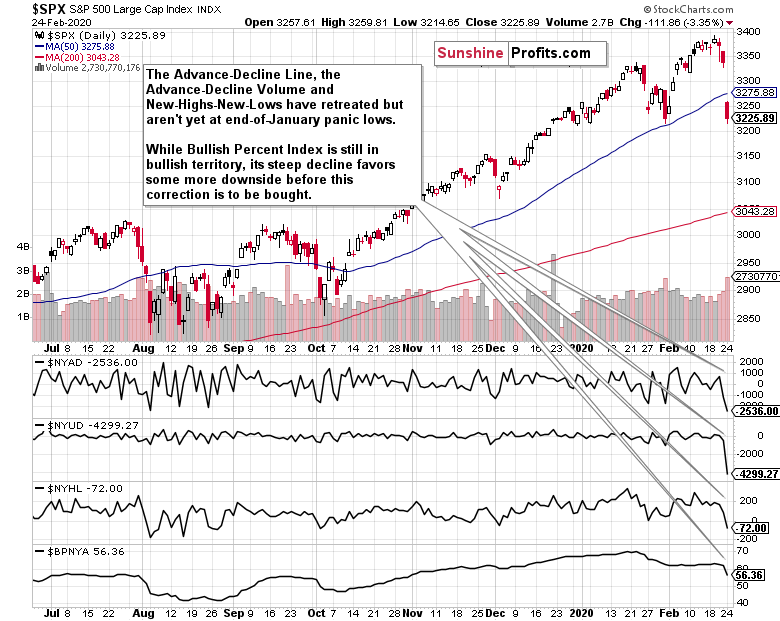
The advance-decline line, the advance-decline volume and new highs minus new lows – they’ve all flipped to the bearish territory, overcoming the panic lows reached at the end of January. Is that a signal that selling is over now?
Not necessarily. While the bullish percent index remains well above 50%, it has steeply turned lower, indicating the changing short-term character of the market. The takeaway for the coming sessions is that buy-the-dip mentality won’t probably rule as strongly as before. While we’re still in a bull market, the bulls need to stabilize prices first.
Can that happen during today’s session? Looking at how meekly they have stepped in yesterday and earlier today, we’re unlikely to see that without more hesitation first. On the other hand, any indecisive move in the short run would relieve the steep decline seen in the daily indicators to some degree. Then, we wouldn’t have to worry about the upper border of the rising black trend channel on the weekly chart suffering a confirmed breakdown.
If the red support zone on the daily chart doesn’t stop the decline, which other area could? The horizontal support marking the November 2019 peak at above 3150 fits the description.
Either way, a retest of yesterday’s lows remains a viable possibility. It would give us a favorable entry point from the risk-reward perspective, and there is one more reason why it’s likely.
The VIX has matched its August highs on a daily basis yesterday.
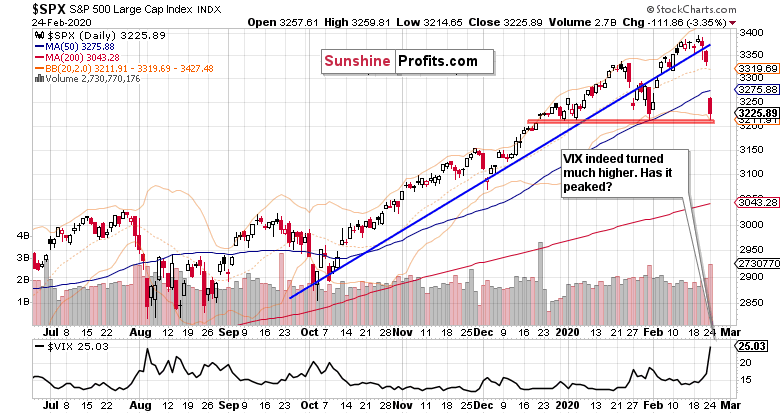
The question is whether yesterday’s volatility reading was the top. On a daily basis, that could be true. This would also support a pause in the downswing’s viciousness and perhaps make the bulls buy more heavily.
Taking all the above into account, it makes sense to both move our limit buy order a bit higher and to tighten our stoploss. Depending on the commitment of the bulls, we’ll manage the open trade accordingly. That’s because on a weekly basis, volatility could spike even more to match the December 2018 highs.
Let’s recall our yesterday’s observations about the red support zone:
(…) that is formed by the December bullish gap, late-December and early-January lows. It has already stopped the slide at the end of January. By the way, that’s reinforced by the proximity of the upper border of the rising black trend channel on the weekly chart.
In order to take advantage of the anticipated push lower, we’re placing a limit buy order at … (the exact price point is reserved for our subscribers) as both the daily and weekly charts show strong support there. This area would mark a favorable setup to enter on the long side.
Downside moves during bull markets are here to either scare you out, or wear you out. This is the formed case. Let’s remember the big picture though – we’re in a stock bull market, actually the longest-running one, and there’re sizable gains ahead to enjoy down the road.
Summing up, the medium-term S&P 500 outlook has deteriorated, and more downside remains probable before this correction is over both in time in in price. This is also apparent on the daily chart. First, the index has broken down below the rising wedge, then also below the rising support line. The latter breakdown is now confirmed. As expected, the divergencies between RSI, CCI and stock prices are being resolved to the downside. But the daily volatility examination shows limited upside, which means that stocks might not fall much further in the very short term. Thus, we would like to take advantage of perfectly natural pullback and get back in on the long side to reap more fruits of this stock bull market. It remains intact and much higher prices are to come. Our aim is to let the many bullish factors in this stock bull market keep working to our benefit. The bulls’ commitment in the nearest session will send a strong signal and we’ll manage the open position accordingly.
We encourage you to sign up for our daily newsletter- it's free and if you don't like it, you can unsubscribe with just 2 clicks. If you sign up today, you'll also get 7 days of free access to our premium daily Stock Trading Alerts as well as our other Alerts. Sign up for the free newsletter today!
Monica Kingsley
Stock Trading Strategist
Sunshine Profits - Effective Investments through Diligence and Care
* * * * *
All essays, research and information found above represent analyses and opinions of Przemyslaw Radomski, CFA and Sunshine Profits' associates only. As such, it may prove wrong and be subject to change without notice. Opinions and analyses were based on data available to authors of respective essays at the time of writing. Although the information provided above is based on careful research and sources that are believed to be accurate, Przemyslaw Radomski, CFA and his associates do not guarantee the accuracy or thoroughness of the data or information reported. The opinions published above are neither an offer nor a recommendation to purchase or sell any securities. Mr. Radomski is not a Registered Securities Advisor. By reading Przemyslaw Radomski's, CFA reports you fully agree that he will not be held responsible or liable for any decisions you make regarding any information provided in these reports. Investing, trading and speculation in any financial markets may involve high risk of loss. Przemyslaw Radomski, CFA, Sunshine Profits' employees and affiliates as well as members of their families may have a short or long position in any securities, including those mentioned in any of the reports or essays, and may make additional purchases and/or sales of those securities without notice.
*******

Monica Kingsley is a trader and financial markets analyst. Checking dozens of charts daily, she integrates their messages with economics and in-depth experience. Trade calls and writing are her cup of tea as much as studies in market histories. Having been at the financial markets when the Great Recession arrived, she experienced many bull and bear markets - be it in stocks, bonds, gold and silver. https://www.monicakingsley.co
More from Silver Phoenix 500


