As Stocks Fell Through The Floor Yesterday, Is The Selling Over Now?


After a two-day flirt with breaking below the short-term bearish technical formation, stocks finally declined yesterday. Well before the closing bell though, the bulls stepped in and erased most of the plunge that happened during the first hour of trading. Has it been all there is to see in this correction?
Let’s check yesterday’s price action in the daily chart’s context (charts courtesy of http://stockcharts.com).
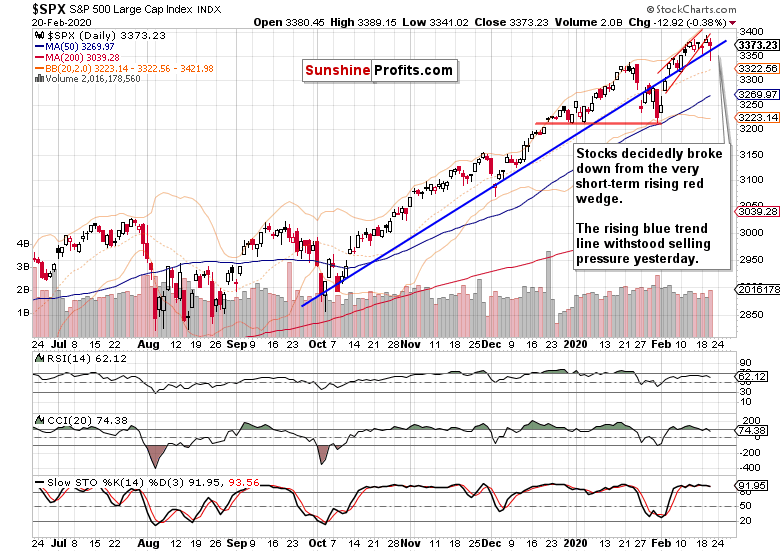
Stocks opened with a bearish gap yesterday, and the bulls’ attempts at higher prices were quickly dealt with. In a selling frenzy, stocks promptly reached the 3340 mark before staging a recovery. The long lower knot tells this story precisely.
The slide resulted not only in a clear breakdown from the very short-term rising red wedge, but also in an intraday breakdown below the rising blue support line. Looking at closing prices though, the bears didn’t power through.
But how likely is it that this is the end of the selling episode? As S&P 500 futures trade at around 3355 at the moment of writing these words, the bears are yet again pushing below the above-mentioned blue support line. Such a price level means a sizable bearish gap at the open, which would likely encourage the bears to sell even harder later today.
So, are we back to selloff Fridays that marked three prior weeks except for the one a week ago? Taking a look at the coronavirus developments, it’s perfectly understandable that the markets are jittery and trigger happy to sell. On one hand, we have the rising Shanghai Composite Index, which ties in well with the earlier way of keeping track of the infections. On the other hand, the growing count of coronavirus cases outside of China that raises fears of turning such places into self-sustaining hotspots with corresponding hits to their economic activities.
Turning back to the technicals, how did yesterday’s slide affect the daily indicators?
The CCI has now issued its sell signal, and the RSI has turned lower from near the 70 level. Stochastics keeps looking extended in its overbought territory.
Yes, there has been deterioration in their posture yesterday – but it’s the volume that tells the story best. And it also points at the things to come next. You see, yesterday’s volume has been noticeably higher than that of the previous upswing days. That tips the scales in favor of the bears, and has implications for the coming sessions.
Therefore, we are of the opinion that there is more selling to come. Just take a look at the decreasing power of the bulls on a daily basis. Can they stage a comeback before we see more short-term price deterioration?
Let’s recall our yesterday’s notes on the Force Index and its divergencies with prices:
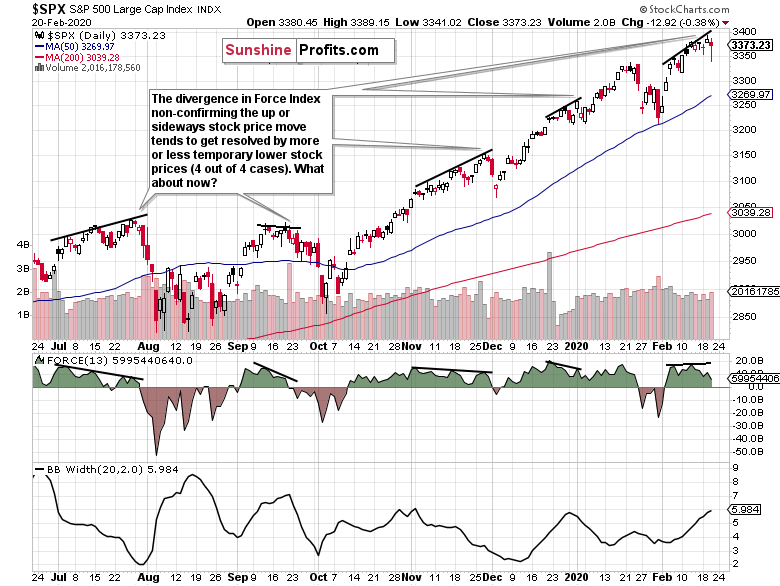
(…) We’ve marked several cases when Force Index has been unable to make new highs while remaining in the positive territory on the above daily chart. Take a good look what have been stock prices doing in the meantime – either scoring new highs, or slowly losing their breath.
And what happened once Force Index declined more noticeably? Prices followed to the downside - on a more or less temporary basis, but nonetheless declined. In all 4 out of the 4 cases examined.
Instead of a slow grind higher, Force Index favors the case for waning bulls’ power. And as volatility expressed by the Bollinger Band Width doesn’t seem to have peaked yet, that calls for more selling to come.
Today’s session close will be insightful, because it would give us weekly closing prices as well. Considering all the above though, it seems more likely that prices wouldn’t stage a steep recovery today, and thus the S&P 500 would finish this week in red. On Monday, we’ll examine the learnings, so stay tuned!
Taking into account all of the above, it’s our opinion that this correction isn’t over yet. The bulls confirmed their not-so-apparent weakness that we told you about in our Wednesday’s Alert, and we haven’t seen a convincing sign that their strength has returned.
In other words, the very short-term risks continue to be skewed to the downside.
However, keeping in mind the Tuesday discussed bullish outlook on the weekly chart, such a downswing would offer us a favorable setup to again enter on the long side and enjoy the gains still ahead in this longest-running stock bull market.
Summing up, the medium-term S&P 500 outlook remains solidly bullish, yet the noticeable signs of deterioration on the daily chart continue to not only to persist, but also to show up. It’s the breakdown below the rising wedge, deteriorating Force Index posture and divergence. Coupled with the volatility examination, it points to more to come in this correction before it’s over. A downside move would offer us an opportune setup to get back in on the long side to reap more fruits of this stock bull market. It remains intact and much higher prices are to come. Our aim is to let the many bullish factors in this stock bull market keep working to our benefit – but the risk of more short-term downside remains too high to ignore.
We encourage you to sign up for our daily newsletter- it's free and if you don't like it, you can unsubscribe with just 2 clicks. If you sign up today, you'll also get 7 days of free access to our premium daily Stock Trading Alerts as well as our other Alerts. Sign up for the free newsletter today!
Monica Kingsley
Stock Trading Strategist
Sunshine Profits - Effective Investments through Diligence and Care
* * * * *
All essays, research and information found above represent analyses and opinions of Przemyslaw Radomski, CFA and Sunshine Profits' associates only. As such, it may prove wrong and be subject to change without notice. Opinions and analyses were based on data available to authors of respective essays at the time of writing. Although the information provided above is based on careful research and sources that are believed to be accurate, Przemyslaw Radomski, CFA and his associates do not guarantee the accuracy or thoroughness of the data or information reported. The opinions published above are neither an offer nor a recommendation to purchase or sell any securities. Mr. Radomski is not a Registered Securities Advisor. By reading Przemyslaw Radomski's, CFA reports you fully agree that he will not be held responsible or liable for any decisions you make regarding any information provided in these reports. Investing, trading and speculation in any financial markets may involve high risk of loss. Przemyslaw Radomski, CFA, Sunshine Profits' employees and affiliates as well as members of their families may have a short or long position in any securities, including those mentioned in any of the reports or essays, and may make additional purchases and/or sales of those securities without notice.
*******

Monica Kingsley is a trader and financial markets analyst. Checking dozens of charts daily, she integrates their messages with economics and in-depth experience. Trade calls and writing are her cup of tea as much as studies in market histories. Having been at the financial markets when the Great Recession arrived, she experienced many bull and bear markets - be it in stocks, bonds, gold and silver. https://www.monicakingsley.co
More from Silver Phoenix 500


