Stocks Get Closer To Last Year’s Record High


Friday’s trading session was bullish, as stocks broke above their short-term consolidation following the first quarterly earnings releases, among other factors. The S&P 500 index broke above the 2,900 level. Will the uptrend extend despite some technical overbought conditions?
The U.S. stock market indexes gained 0.5-1.0% on Friday, breaking above the recent trading range, as investors’ sentiment improved following the first quarterly earnings releases, among other factors. The S&P 500 index retraced more of its October-December downward correction of 20.2% on Friday. It broke above the 2,900 level. The broad stock market's gauge is now just 1.1% below September the 21st record high of 2,940.91. The Dow Jones Industrial Average gained 1.0% and the Nasdaq Composite gained 0.5% on Friday.
The nearest important resistance level of the S&P 500 index is now at 2,920-2,940, marked by the mentioned record high, among others. On the other hand, the support level is now at 2,900, marked by the recent resistance level. The support level is also at 2,860-2,865, marked by the recent local lows.
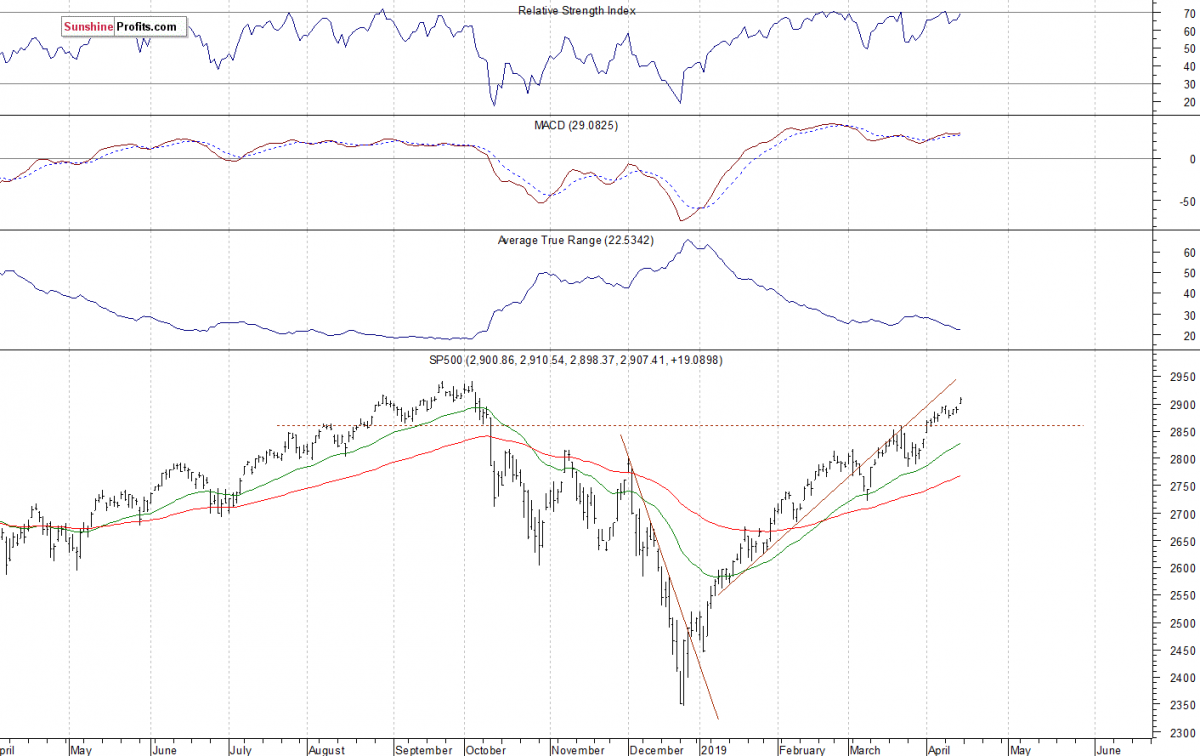
The broad stock market retraced all of its December sell-off and it broke above the medium-term resistance level of around 2,900 on Friday. So is it still just a correction or a new medium-term uptrend? We may see an attempt at getting back to the record high. There have been no confirmed negative medium-term signals so far. The index got closer to its last October all-time high, as we can see on the daily chart:
Consolidation Following Friday’s Rally
Expectations before the opening of today's trading session are virtually flat, because the index futures contracts trade between -0.1% and +0.2% vs. their Friday’s closing prices. The European stock market indexes have been mixed so far. Investors will wait for the Empire State Manufacturing Index release at 8:30 a.m. They will also wait for the quarterly earnings releases. Stocks will likely fluctuate following Friday’s rally. There have been no confirmed negative signals so far. However, we could see some more uncertainty as the broad stock market’s gauge gets closer to the mentioned September’s record high.
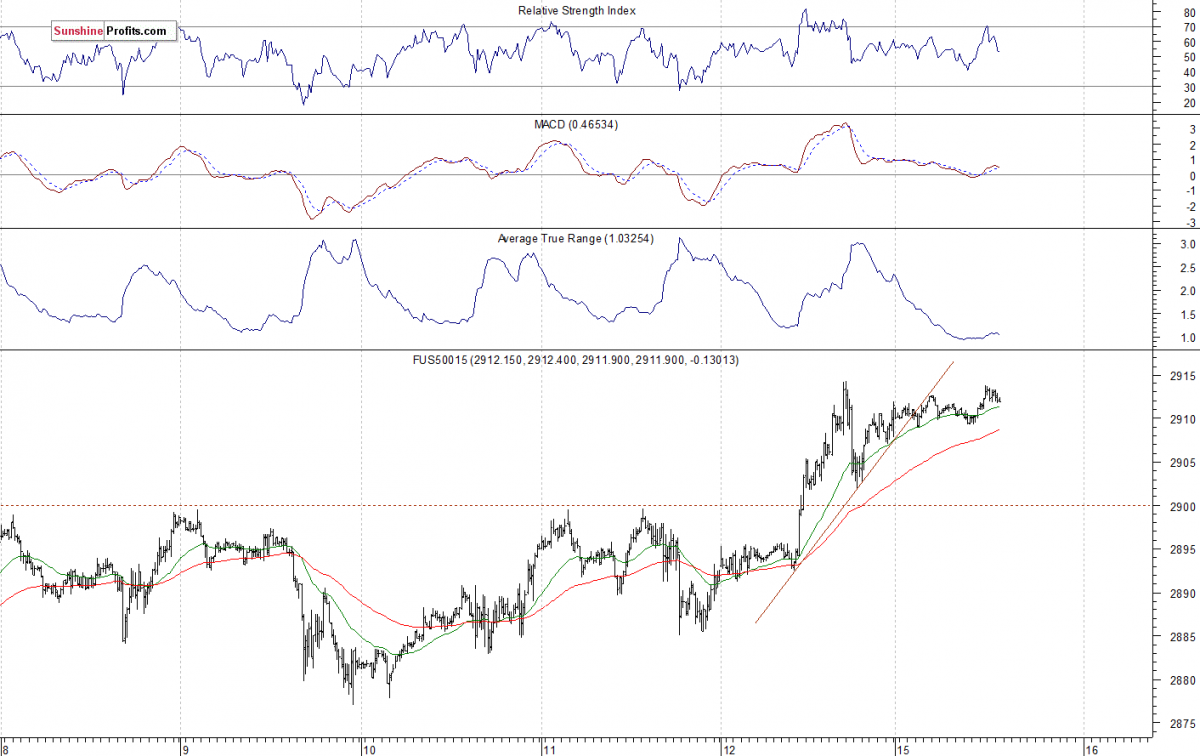
The S&P 500 futures contract trades within an intraday consolidation, as it remains above the 2,900 mark. The nearest important resistance level is at around 2,920. On the other hand, the support level is at 2,880-2,900, among others. The futures contract remains close to the new medium-term high above the 2,900 level, as the 15-minute chart shows:
Nasdaq Also Going Sideways
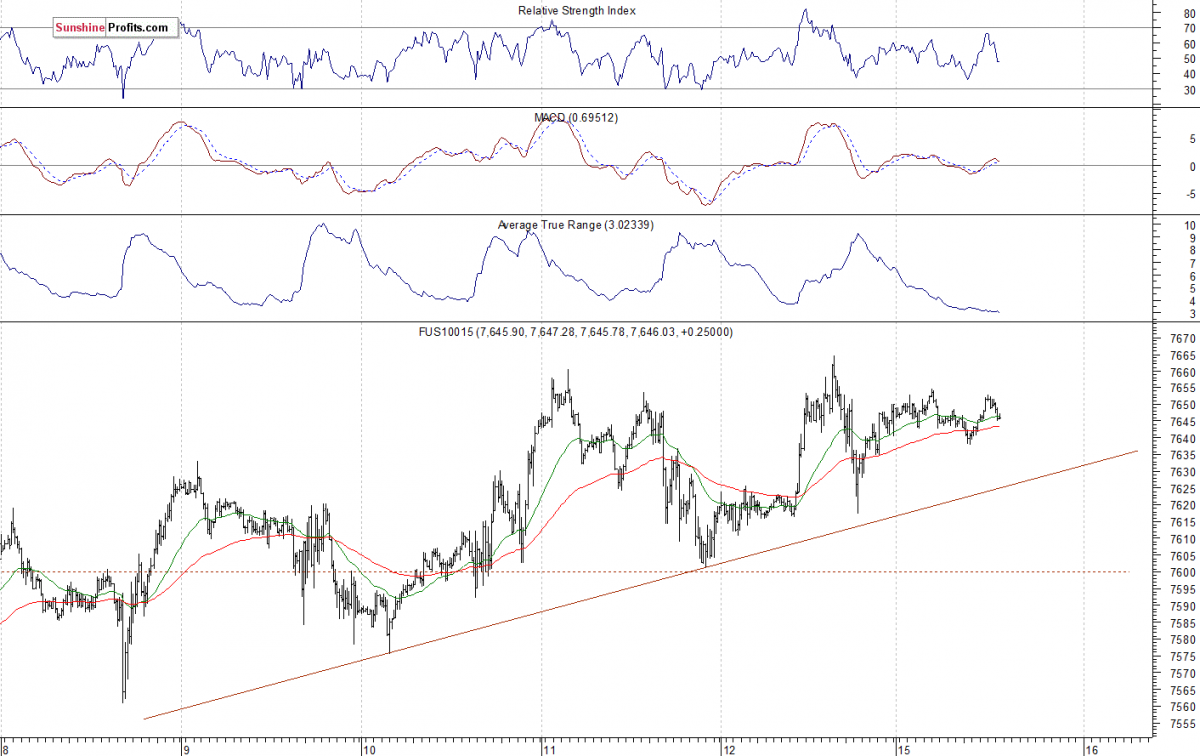
The technology Nasdaq 100 futures contract follows a similar path, as it trades within an intraday consolidation. The market slightly extended its medium-term uptrend on Friday, but then it continued to trade along the recent local high. The nearest important resistance level is at around 7,650-7,700. On the other hand, the support level is at 7,600. The Nasdaq futures contract trades along its last week’s local highs, as we can see on the 15-minute chart:
Microsoft at Another New Record High
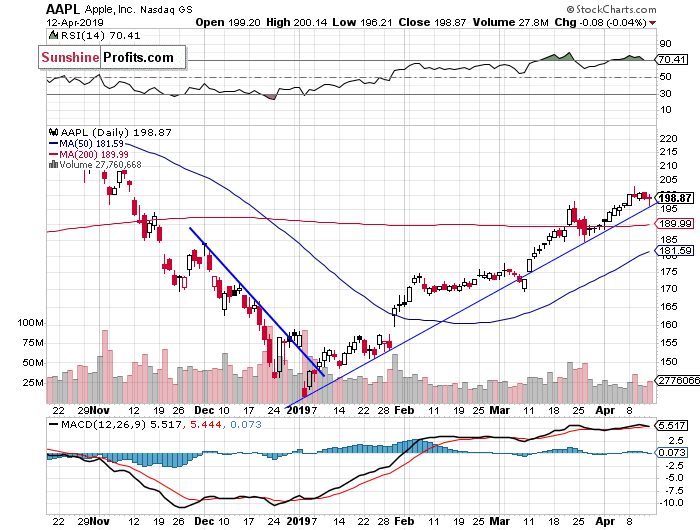
Let's take a look at the Apple, Inc. stock (AAPL) daily chart (chart courtesy of http://stockcharts.com). The stock accelerated its uptrend recently and it got close to the resistance level of $200. The market continues to trade along the medium-term upward trend line:
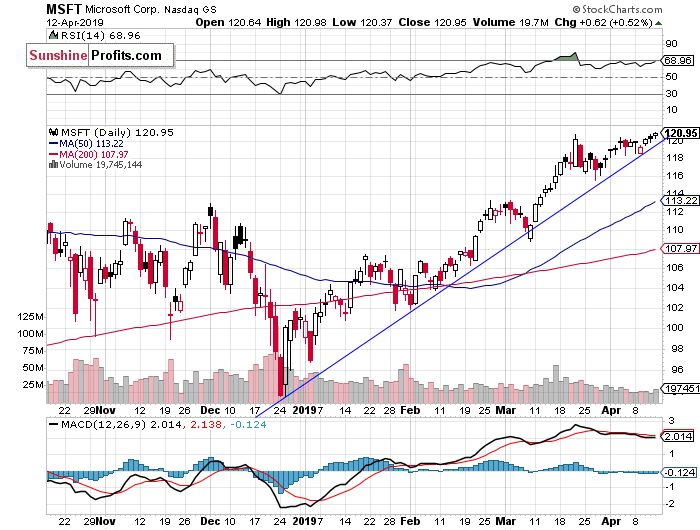
Now let's take a look at the daily chart of Microsoft Corp. (MSFT). The stock reached the new record high on Friday as it extended its recent advance. The market continues to trade along the three-month-long upward trend line:
Dow Jones Closer to Local High Again
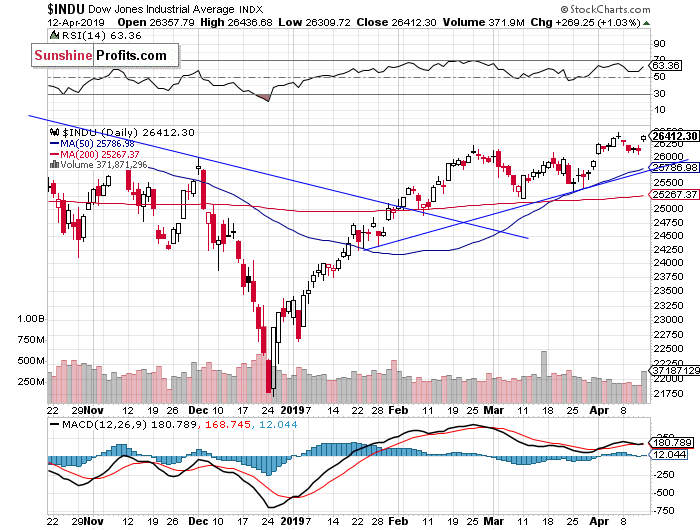
The Dow Jones Industrial Average broke above its February local high recently and it extended the medium-term uptrend. The next resistance level is at around 26,800-27,000, marked by the last year’s topping pattern and the record high of 26,951.8. On Tuesday it retraced its recent advance. Then on Friday it got back closer to the local high again:
Nikkei Breaking Higher
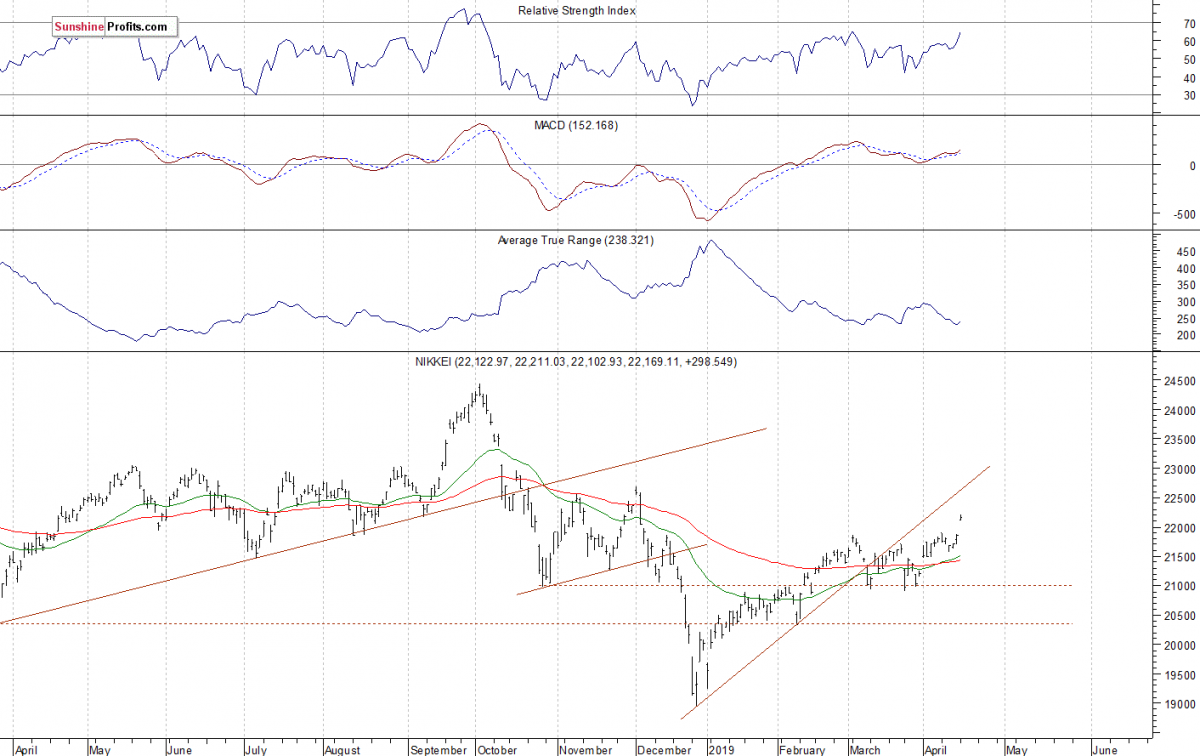
Let's take a look at the Japanese Nikkei 225 index. It accelerated the downtrend in late December, as it fell slightly below the 19,000 level. Then it was retracing the downtrend for two months. In March the market went sideways. Recently the index got close to 21,500-22,000 again. And today it broke above the 22,000 mark:
The S&P 500 index extended its medium-term uptrend on Friday, as it got the highest since the early October. The broad stock market broke above its week-long consolidation. We previously wrote that it looked like a flat correction within an uptrend. And it did. But will the market reach the September’s record high? We may see some profit-taking action, as stocks trade closer to their resistance levels.
If you enjoyed the above analysis and would like to receive free follow-ups, we encourage you to sign up for our daily newsletter – it’s free and if you don’t like it, you can unsubscribe with just 2 clicks. If you sign up today, you’ll also get 7 days of free access to our premium daily Gold & Silver Trading Alerts. Sign up today!
Paul Rejczak
Stock Trading Strategist
Sunshine Profits - Effective Investments through Diligence and Care
* * * * *
Disclaimer
All essays, research and information found above represent analyses and opinions of Paul Rejczak and Sunshine Profits' associates only. As such, it may prove wrong and be a subject to change without notice. Opinions and analyses were based on data available to authors of respective essays at the time of writing. Although the information provided above is based on careful research and sources that are believed to be accurate, Paul Rejczak and his associates do not guarantee the accuracy or thoroughness of the data or information reported. The opinions published above are neither an offer nor a recommendation to purchase or sell any securities. Mr. Rejczak is not a Registered Securities Advisor. By reading Paul Rejczak’s reports you fully agree that he will not be held responsible or liable for any decisions you make regarding any information provided in these reports. Investing, trading and speculation in any financial markets may involve high risk of loss. Paul Rejczak, Sunshine Profits' employees and affiliates as well as members of their families may have a short or long position in any securities, including those mentioned in any of the reports or essays, and may make additional purchases and/or sales of those securities without notice.
More from Silver Phoenix 500


