The Stunning Silver Price Setup


We now have the most bullish setup for silver that we have ever seen. After trading sideways / down for over 20 months now, investors have completely lost interest in it, which is of course the perfect breeding ground for a huge rally that seems to come out of nowhere. As we will proceed to see both COTs and the silver to gold ratio are at record extremes that point to a major bullmarket in silver starting imminently.
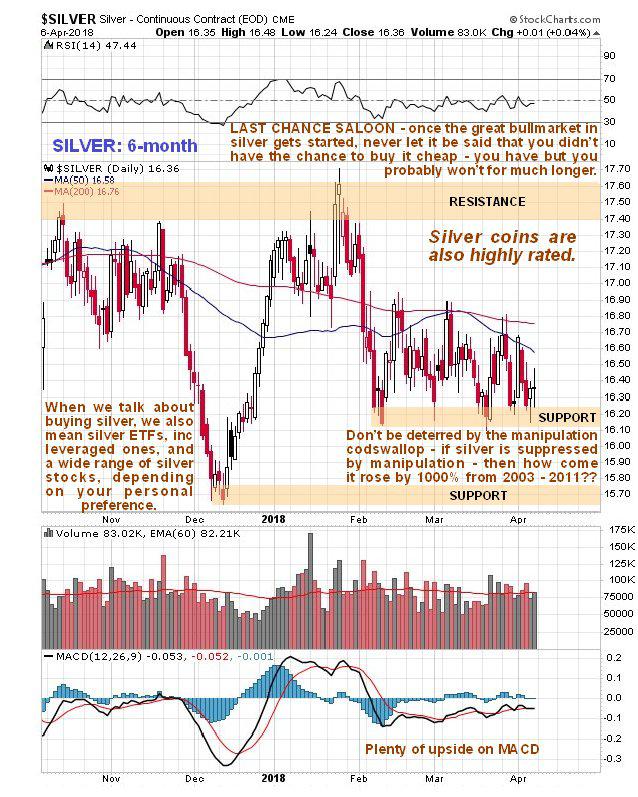
We will begin by looking at the latest price charts for silver. The 6-month chart looks dead boring, which is of course why those who are habitually wrong are making the dangerous mistake of shorting it. If you can stay awake for long enough looking at it, you will observe a dreary neutral trend and somewhat bearishly aligned moving averages – it certainly isn’t this chart that stirs our interest in silver.
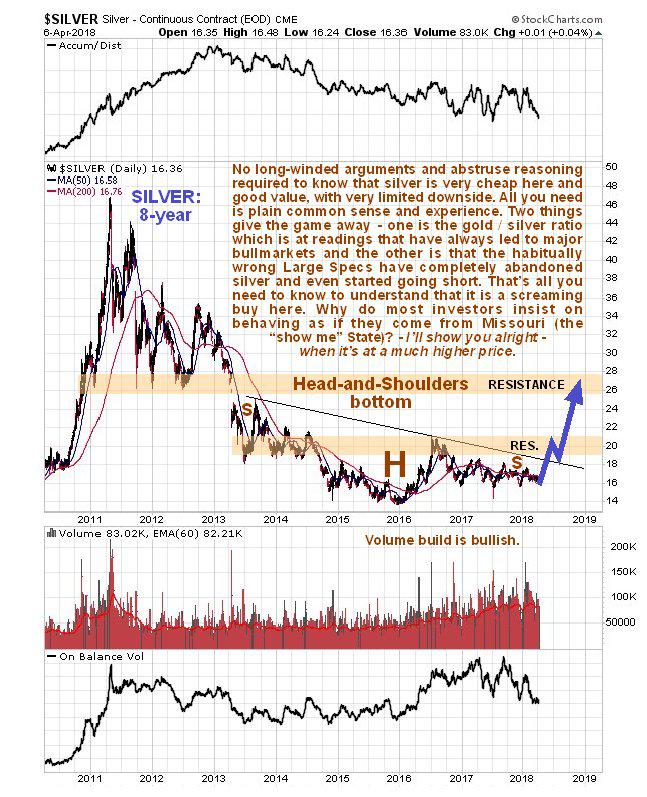
If you know what you are looking at the 8-year chart presents a much more encouraging picture. While this chart superficially looks boring and bearish too at first sight, on closer inspection we realize that a downsloping Head-and-Shoulders bottom is completing. While downsloping Head-and-Shoulders bottoms don’t inspire much confidence, we should be mindful that the parallel one visible on gold’s 8-year chart is not downsloping, it is flat-topped, i.e. relatively normal, and the downslope on the silver H&S bottom pattern merely reflects the fact that silver always tends to underperform gold at the tail end of sector bearmarkets, which is the reason why the silver / gold ratio that we will soon look at is so important. Here we should also note that the downslope of silver’s base pattern also serves to camouflage what is going on, so that the mob aren’t interested in it at all, which is great because it means that we can buy a range of silver investments off them at firesale prices well before it starts higher, which is what we have been doing for weeks now.
Now let’s turn to the latest COT chart, which is very interesting indeed as it provides compelling evidence that silver is getting very close to suddenly busting out upside, at which point it will likely spike dramatically as the legions of semi-conscious traders shorting it are instantly panic stricken and race to cover. On this chart we see that after banging their heads against a wall for years by being long silver, the habitually wrong Large Specs (blue bars) have finally given up on it and in recent weeks have even had the temerity to start shorting it. This is something we have never seen before in 15-plus years of following this market and is the surest indication you could hope to see that silver is about to take off higher. Making the situation even more explosively bullish is the steep rise in open interest of recent weeks, which means that there are more traders to be caught out who will need to cover if the price starts to rise. This is an astoundingly bullish COT chart.
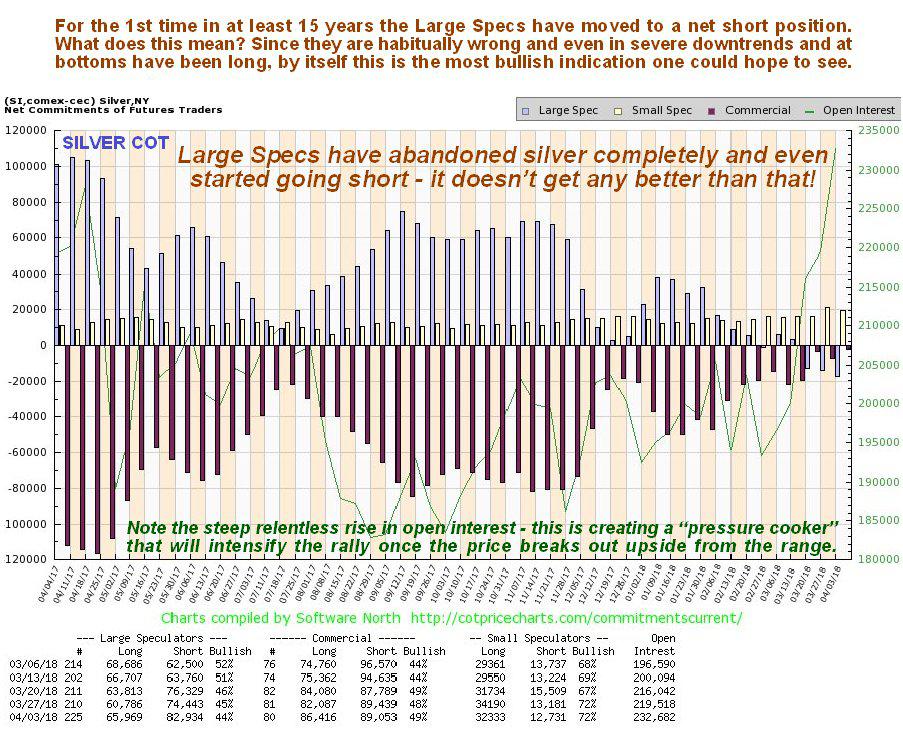
Click on chart to popup a larger clearer version.
We also have record bullish extremes in the latest Hedgers chart. As we can see, high readings on this chart on the left side of it, when silver was in a bullmarket, led to major bullmarket advances, and even during the following bearmarket always led at least to a rally of sorts. Lest you make the mistake of thinking “Oh well, maybe it just means another bearmarket rally” don’t forget the completing Head-and-Shoulders bottom shown above and the fact that the Large Specs have given up and started to go short for the 1st time ever.
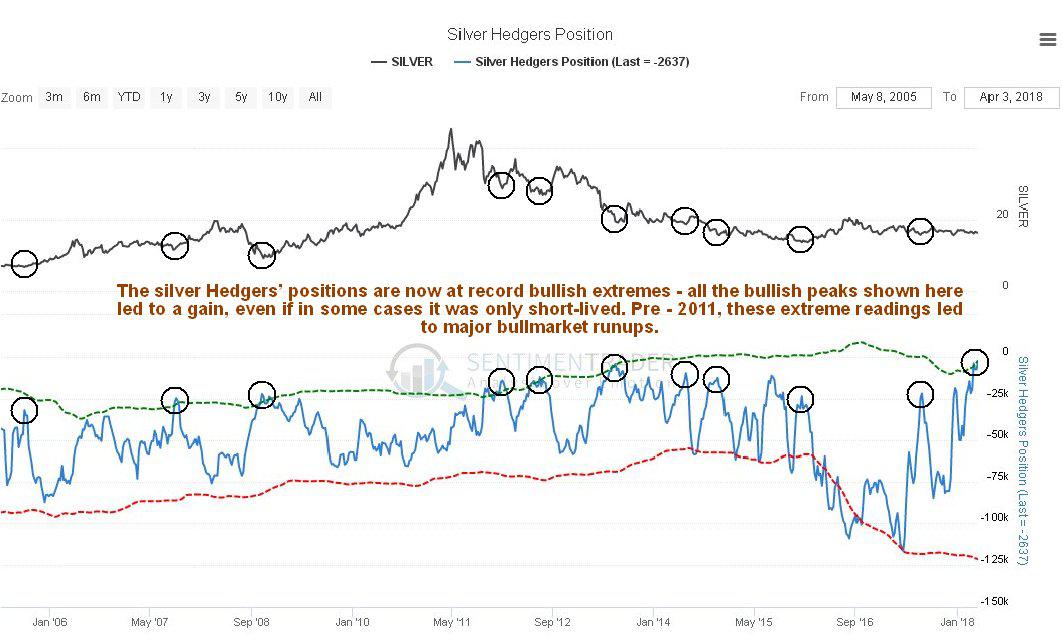
Click on chart to popup a larger clearer version. Chart courtesy of sentimentrader.com
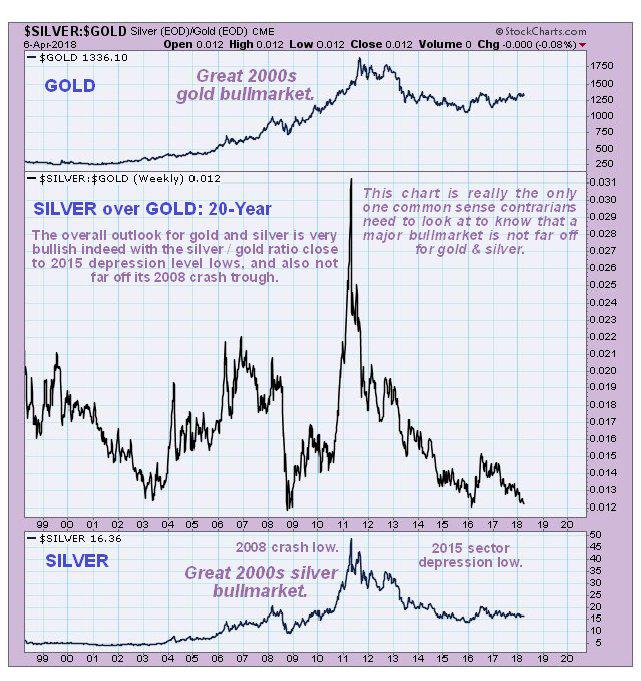
Finally, if all the above presented evidence isn’t enough to convince you that silver is drawing close to a new bullmarket, see what you make of our last chart, for the silver / gold ratio going back 20 years. As mentioned above, gold is favored more and more over silver as sector bearmarkets continue, because it is viewed as more solid and safer, so that silver gets cheaper and cheaper relative to gold, until an extreme is reached and the pendulum starts to swing back the other way with a new sector bullmarket. There were only 3 other occasions in the past 20 years that this ratio sank to the sort of levels it is at now – back in 2003 as the sector bullmarket was just getting started, then at the lows associated with the 2008 market crash, and finally in the depths of the PM sector depression at the end of 2015 and early 2016. After the 1st two occasions of these low readings, silver entered into a major uptrend that took it much higher, and on the 3rd occasion early in 2016 a significant rally followed, and now the ratio appears to be double bottoming with that low as gold and silver complete their base patterns. It is therefore logical to expect this setup to birth another major silver bullmarket, especially given the additional supportive factors that we looked at above.
Conclusion: A major new silver bullmarket looks imminent that is expected to kick off with a dramatic spike, due to a wave of panic short covering.
********
More from Silver Phoenix 500


