Two Mines Supply Half Of US Silver Production…And The Real Cost To Produce Silver


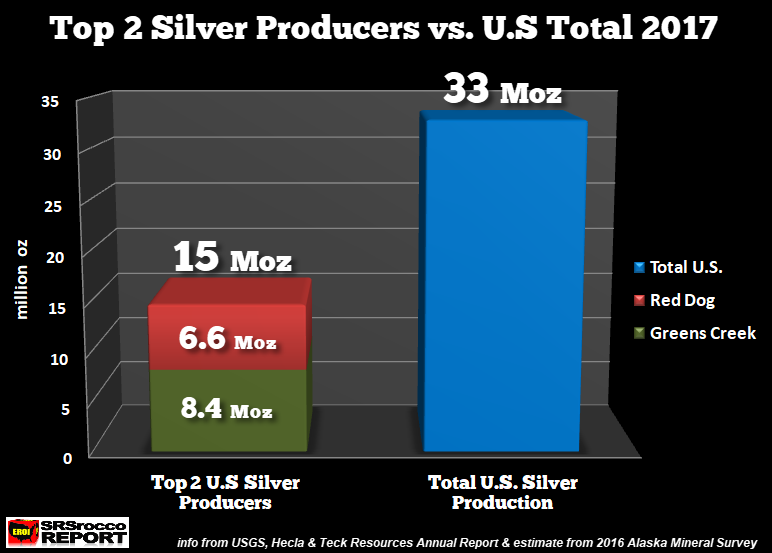
Just two mines supply the United States with half of its silver production, and both are located in Alaska. It’s quite amazing that Alaska now produces half of the silver for the U.S. when only 30 years ago total mine supply from the state was less than 50,000 oz per year. The silver produced in Alaska comes from the Greens Creek and Red Dog Mines. One is a primary silver mine and the other a zinc-lead base metal mine.
Even though Hecla’s Greens Creek Mine is labeled as a primary silver mine, 56% of its revenues come from its gold, zinc, and lead metal sales/strong>. However, Teck Resources, that runs the Red Dog Mine doesn’t even list its silver production in its financial reports. Because Red Dog produces one heck of a lot of zinc and lead, their silver production doesn’t amount to much in the way of revenues.
For example, the Red Dog Mine produced 542,000 metric tons (1.1 billion pounds) of zinc and 110,000 metric tons (222 million pounds) of lead, while its estimated silver production was 6.6 million oz (Moz). According to Teck’s 2017 Annual Report, total revenues from the Red Dog Mine were $1.75 billion. With the estimated silver price of $17 in 2017, total revenues from 6.6 Moz of silver were $112 million, or just 6% of the total.
In addition, Hecla’s Greens Creek Mine in Alaska produced 8.4 Moz of silver this year, down from 9.2 Moz in 2016. As I mentioned, the Greens Creek Mine also generated a lot of gold, zinc, and lead, equaling $182 million of the total revenues of $326 million (including treatment costs).
The USGS just came out with their final Silver Mineral Industry Survey for 2017, reporting that the U.S. produced 33 million oz (Moz), down from 37 Moz the previous year. U.S. silver production declined due to the union strike and the shut down of Hecla’s Lucky Friday Mine. As we can see, Greens Creek and Red Dog accounted for 15 Moz of the total 33 Moz of U.S. silver production:
While Greens Creek and Red Dog supplied nearly half of U.S. silver production last year, the next two largest mines provided 21% of the total. Coeur’s Rochester Mine in Nevada produced 4.7 Moz of silver while the Bingham Canyon Mine, the country’s largest copper mine, supplied 2.2 Moz. Almost 7 Moz of silver came from these two mines alone.
Thus, the top four silver producing mines in the United States accounted for two-thirds of the supply… 22 Moz:
Greens Creek, Alaska (8.4 Moz) = Primary Silver Mine
Red Dog, Alaska (6.6 Moz) = Zinc-Lead Base Metal Mine
Rochester Mine, Nevada (4.7 Moz) = Gold-Silver Mine
Bingham Canyon Mine, Utah (2.2 Moz) = Copper Mine
The majority of the remaining 11 Moz of U.S. silver production comes as a by-product of gold and copper mining, predominantly in Nevada and Arizona.
What’s The Real Cost To Produce Primary Silver?
One of the most misunderstood metrics in the mining industry is the real cost to produce primary silver. Now, I am not talking about the cost to produce silver as a by-product of gold or base metal mining. Because 30% of global silver mine supply comes from primary mines, the market determines the silver price based on its cost of primary silver production.
Unfortunately, there are still investors who believe that it only costs $5 an ounce to produce silver. And who can blame them when Hecla comes out and reports that its AISC – All-In Sustaining Cost for its Greens Creek Mine was $5.76. If Hecla’s Greens Creek Mine was profitable at $5.76 an ounce, then why did the company state a $23 million net income loss for the year? Well, part of the reason for the net income loss was due to costs associated with the suspension of its the Lucky Friday Mine as well as losses on derivative contracts.
However, if we factor out some of those costs and look at Hecla’s Cash Flow Statement, the company actually stated $18 million in positive Free Cash Flow:

We arrive at a positive Free Cash Flow by subtracting the Additions of properties, plant, and equipment (CAPEX spending) from the Net cash provided by operating activities ($116 million – $98 million). If we take that $18 million and divide it by the 12.5 Moz of total silver production, then Hecla made about $1.44 of free cash flow per ounce. Hecla’s realized silver price in 2017 was $17.23. So, if we subtract the $1.44 cost per oz from $17.23, then Hecla’s estimated silver breakeven is about $15.80 an ounce.
If Hecla’s estimated breakeven is nearly $16, then how are they posting a $5.76 AISC – All-In Sustaining Cost?? Let’s take a look at the breakdown of their cost structure at their mines:
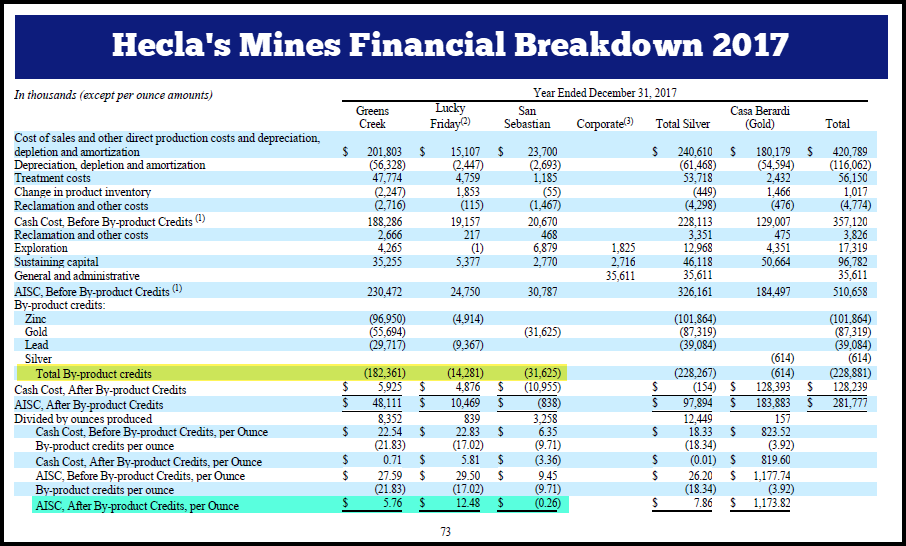
The reason Hecla can report such a low AISC is by deducting their gold and base metal revenue, which is labeled as “By-product Credits.” The Greens Creek Mine had $182 million in gold, zinc and lead credits. By gosh, it’s no wonder Hecla is reporting such a low AISC because it deducted 56% of its revenues.
By adding up all the by-product credits from the three silver mines, it would equal $228 million. However, if we deduct the treatment costs of $48 million from that total, it turns out to be $180 million. Now, let’s put our THINKING CAPS on for a minute. How would the removal of $180 million from Hecla’s Net Income and Free Cash impact their financials?
Hecla’s Net Income = -$23 million – $180 million = -$203 million
Hecla’s Free Cash Flow = $18 million – 180 million = -$162 million
So, if Hecla actually deducted its by-product metal revenues (credits) from its financials, it would be reporting a $203 net income loss and a negative $162 million in free cash flow. Which means, the ASIC is a totally BOGUS metric that should be thrown out the window along with Cash Cost accounting.
While Hecla is labeled as a primary silver mining company, they are first and foremost, a MINING COMPANY. Hecla needs its gold, zinc, and lead metal sales to remain profitable or at least, to keep losses to a minimum. Anyone who uses the AISC -All-In Sustaining Cost as a metric for calculating the cost to produce silver needs to get a job printing money for the Federal Reserve.
Way too many investors fall for this nonsense and do not understand that CASH COSTS and AISC are totally useless in determining the profitability of a company. Another thing I hear all the time from less sophisticated investors is that these mining companies use a lot of WRITE-OFFS, such as Depreciation, Depletion, and Amortization to show higher costs. Investors who believe these mining companies are making up deductions so they can show less profit, don’t understand the accounting industry.
Without getting into too many details, if you look once again at Hecla’s Cash Flow statement, you will see that the Depreciation, Depletion, and Amortization are offset by the additional CAPEX spending:
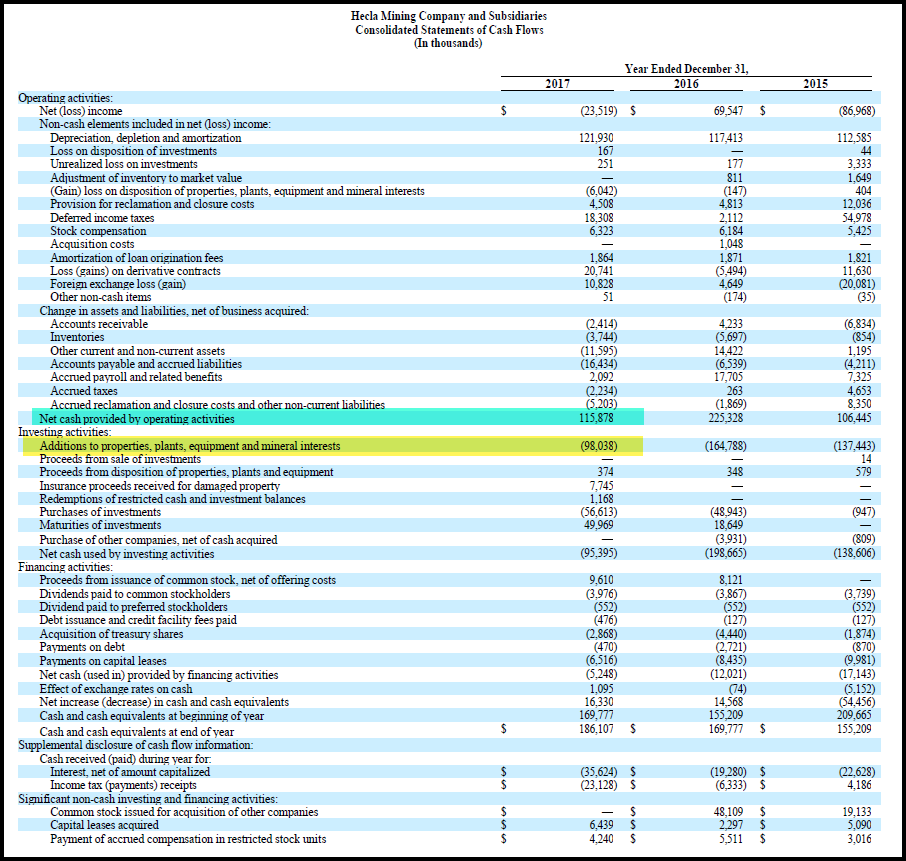
If we add up the total Depreciation, Depletion, and Amortization (D,D & A) from 2015-2017, it totals $352 million. Thus, unsophisticated investors might think Hecla has made $352 million in profit because they are just writing off D,D & A to show more costs. Well, if we add up the CAPEX spending highlighted in yellow, Hecla spent $400 million on mostly sustaining and replacing production. Which also means, Hecla’s net free cash flow for 2015-2017 was a negative $48 million ($400 – $352).
One more thing. Because Hecla holds $502 million in debt, it is paying a hefty $32 million a year just to service its debt. Now, to put it another way, Hecla paid $2.80 per ounce of silver just to cover their interest expense last year.
By investigating Hecla’s financial statements, and doing some forensic analysis, we can plainly see that primary silver mining companies are not producing silver anywhere near $5 an ounce. If you have read this article and still believe the primary silver mining industry is producing silver at $5 an ounce, then you need to sell all your precious metals and buy Netflix and Amazon stock, hand over fist.
FINAL WORD: About My Gold & Silver Analysis
For some odd reason, I continue to receive emails and comments from individuals who state that the silver and gold prices are not taking off as I forecasted in my articles and videos. So, I thought I would CLARIFY the issue.
PLEASE STOP looking at the markets on a DAY TO DAY BASIS… it will drive you bananas. The trends that I forecasted will take place over the next 1-2 years. As I mentioned in my videos, it took nearly two years for the Dow Jones Index to fall 53% from its high in July 2007 to its low in Feb 2009. Nothing goes down in a straight line… especially BITCOIN and the CRYPTOS.
So, be patient. The fundamentals for STOCKS, BONDS, & REAL ESTATE are just as lousy today as they were in January when the market peaked. Give it some time and don’t sweat the small stuff.
Lastly, individuals who believe the Precious Metals Dealers are the shills and swindlers pushing worthless gold and silver, please get your head examined. I hate to be so blunt, but it does seem like IQ’s have dropped considerably over the past few years. I would kindly like to remind these Fiat Money Einsteins that there is no intrinsic value in paper money unless you want to burn it or use it to wipe one’s bottom.
However, gold and silver can be used in jewelry and industry. If you take your gold jewelry to a pawnshop, you are very likely to receive close to spot, $1,300 an ounce and $16 an ounce for silver. Now, go to Venezuela and see how much the INTRINSIC VALUE is for the Bolivar. At best, the intrinsic value of a Federal Reserve Note is its printing cost. Currently, it cost about $0.14 to produce a $100 bill.
********
More from Silver Phoenix 500


