US Dollar Set For Massive Smackdown


The US Dollar Index price action has played out exactly as forecast in recent subscriber analysis. That analysis reduced the price expectation for the bear rally. To be sure the recent high of 97.62 was a bingo hit.
Let’s review the technicals…beginning with the daily chart.
US DOLLAR INDEX DAILY CHART
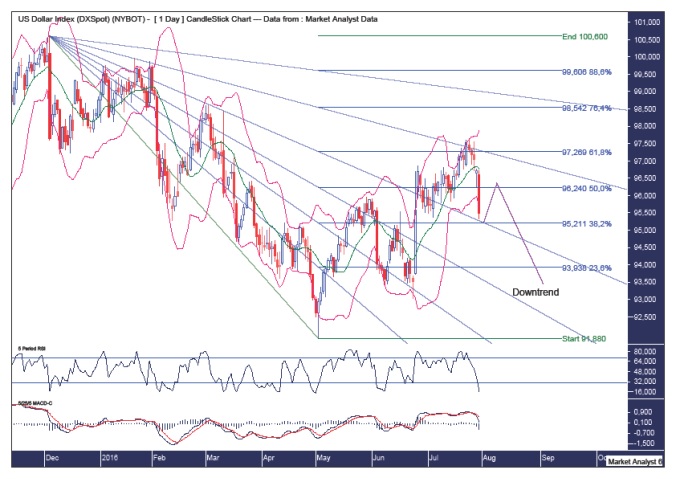
Previous analysis forecast this bear rally to clip the 61.8% Fibonacci retracement level of 97.26. Nice.
Previous analysis also forecast this bear rally to top out around resistance from the 76.4% angle. Nice again.
Price is now back down near the 61.8% angle and I expect some very temporary support to come in shortly and lead to a weak little rally. This rally should provide bears one last opportunity to get short before a big whoosh south commences.
The Bollinger Bands show price is back at the lower band and any subsequent rally will struggle to get back to the middle band in my opinion.
The RSI is looking very weak while the MACD indicator has just made a bearish crossover.
Let’s move onto the monthly chart.
US DOLLAR INDEX MONTHLY CHART
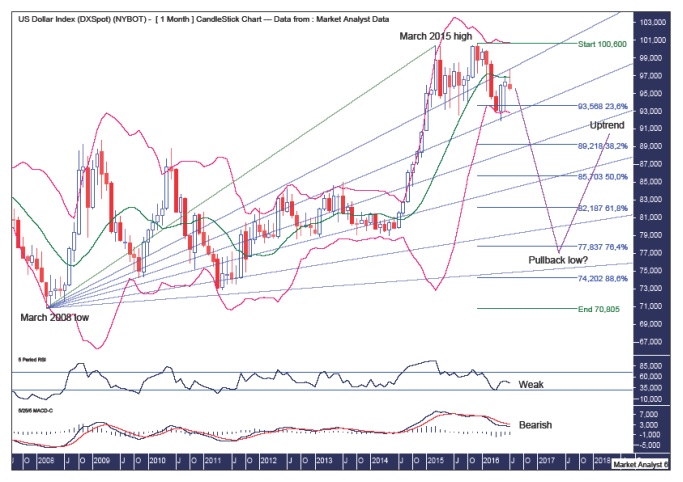
Previous analysis forecast this bear rally to top out around resistance from the 23.6% Fibonacci Fan angle and that is exactly what has occurred. I favour the final bear market low to be down at least at the 76.4% angle and possibly even the 88.6% angle.
The projection for pullback low remains unchanged being between the 76.4% Fibonacci retracement level at 77.83 and the 88.6% level at 74.20.
The Bollinger Bands show the middle band providing resistance as expected and laid out in previous analysis.
The RSI is weak while the MACD indicator is bearish.
Let’s wrap up the analysis by reacquainting ourselves of the even bigger picture using the quarterly chart.
US DOLLAR INDEX QUARTERLY CHART
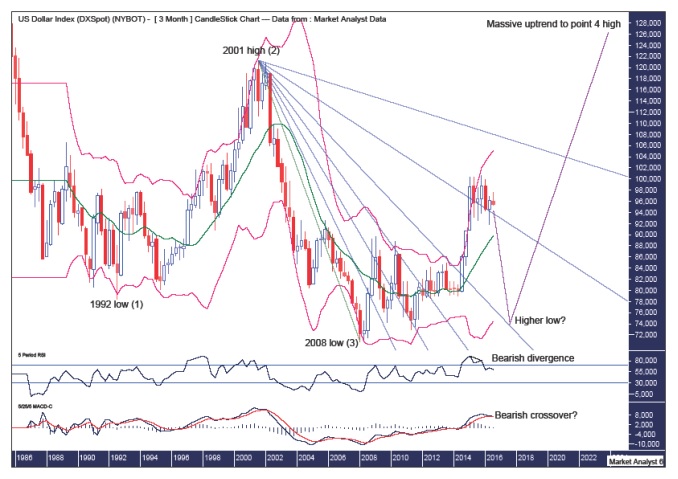
I have shown this chart before and it lays out my expectation of a massive 5 point broadening low in process with points 1 to 3 already in place. Price is now on its way to a point 4 high but I expect some volatile price action before that then.
The Bollinger Bands show price has left the upper band and next stop appears to be the middle band with the final low, a higher low, to be around support from the middle band.
I have drawn a Fibonacci Fan from the 2001 high to 2008 low. Price has recently been flirting above the 76.4% angle but I believe this a false dawn and price is set to break below and then get smashed down to the 61.8% angle to set up the higher low.
I expect this quarterly candle to form a bearish outside reversal candle which means price will have to take out the previous Quarter’s low of 91.88
The RSI shows a bearish divergence while a bearish crossover in the MACD indicator looks imminent.
Summing up, I expect price to get absolutely creamed over the next 12 months or so with the bears set for a big feast!
********
© 2016 Copyright The Voodoo Analyst - All Rights Reserved
Disclaimer: The above is a matter of opinion provided for general information purposes only and is not intended as investment advice. Information and analysis above are derived from sources and utilising methods believed to be reliable, but we cannot accept responsibility for any losses you may incur as a result of this analysis. Individuals should consult with their personal financial advisors. Put simply, it is JUST MY OPINION.
More from Silver Phoenix 500


