US Major Indexes Retest Critical Price Channel Resistance


News, again, drives the US stock market and major indexes higher as optimism of a US/China trade agreement floods the news wires. As we've been suggesting, the global markets continue to be news-driven and are seeking any positive news related to easing trade tensions and capital markets. We believe any US/China trade deal would be received as very positive news by the global capital markets – yet we understand the process of achieving the components of the “deal” would likely still be 6 to 24 months away.
Still, with the strength of the US economy and the potential that some deal could be reached before the end of 2019 setting positive expectations, the US stock market and major indexes rallied last Thursday and Friday (October 10 and 11). As the long holiday weekend sets up with no trading on Monday, it will be interesting to see what is potentially resolved between President Trump and the Chinese before the markets start to react on Sunday and Monday nights. Make sure up opt-in to our free market trend signals newsletter.
Our research team wanted to highlight some very key elements related to technical price theory and technical analysis. These weekly charts highlight what we believe is “key resistance” in the US major indexes and share our research team's concern that the markets may be reacting to news more than relying on fundamental economic and earnings valuations. In past articles, we've highlighted how a “capital shift” is continuing to take place where foreign capital is actively seeking safety and security for future returns. This leads to a shift in how capital is being deployed throughout the globe.
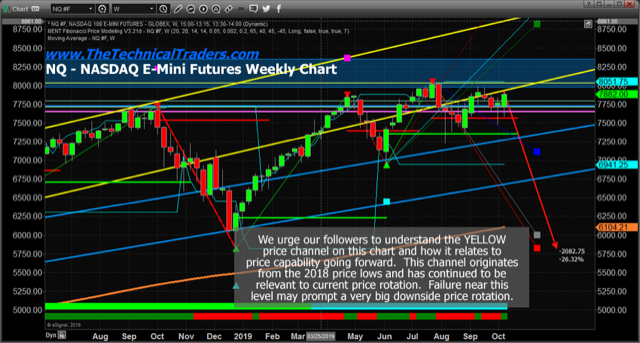
The current price channels in these Weekly charts highlight two key facets of the current market setup. Either the US stock market will attempt to rally above this lower yellow price channel and attempt to regain strength between the two yellow price channels, or it will fail near the current price level and attempt to identify new support somewhere below the current price rotation ranges.
Just a few days ago, we posted this research article to alert traders of the Pennant/Flag formation that is setting up in the US markets …
October 7, 2019: US Stock Markets Trade Sideways – Waiting On News/Guidance.
Nasdaq Weekly Chart
With the holiday weekend upon us, we believe the news and economic data will continue to drive the market's future moves and that volatility will continue to increase.
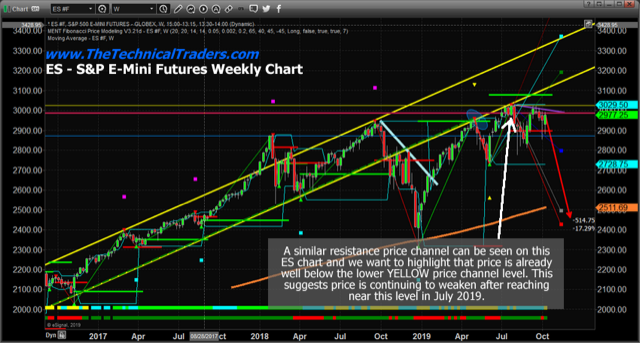
This Weekly ES chart highlights a similar setup, yet one key fact must be understood. Price has already fallen away from the lower YELLOW price channel level and established a “lower high” price rotation recently. Any price rally failure near this level may prompt a very big downside move. The price must continue to rally above 3100 is price makes any attempt at further gains.
CONCLUDING THOUGHTS
We believe skilled technical traders have already digested and are well aware of the risks that are present in the current market environment. We've been urging our followers to stay mostly in cash and to consider very strategic, expertly timed, investments when price trends are relatively secure.
This is not a speculative market any longer – this is a very volatile and uncertain market that is currently resting as major resistance levels. Don't get overly aggressive at this point. It is better for the markets to tell us what it wants to do. Lower risk, lower chance of disaster and live to trade another day – these should be hammered into the heads of traders at this stage of the markets.
Our morning coffee video analysis recap is the one thing… that single investment that’s going to turn into the greatest investment you’ve ever made for your trading.
As a technical analysis and trader since 1997, I have been through a few bull/bear market cycles. I believe I have a good pulse on the market and timing key turning points for both short-term swing trading and long-term investment capital. The opportunities are massive/life-changing if handled properly.
Be sure to ride my coattails as I navigate these financial markets and build wealth while others lose nearly everything they own during the next financial crisis.
I can tell you that huge moves are about to start unfolding not only in metals, or stocks but globally and some of these supercycles are going to last years. My simple technical trading strategy using ETFs will allow you to follow the markets closely and trade with it so you never get caught on the wrong side of the market with big losses.
Chris Vermeulen
Subscribe Today - www.TheTechnicalTraders.com
NOTICE: Our free research does not constitute a trade recommendation or solicitation for our readers to take any action regarding this research. It is provided for educational purposes only. Our research team produces these research articles to share information with our followers/readers in an effort to try to keep you well informed. Visit our web site to learn how to take advantage of our members-only research and trading signals.
*********

Chris Vermeulen has been involved in the markets since 1997 and is the founder of Technical Traders Ltd. He is an internationally recognized technical analyst, trader, and is the author of the book: 7 Steps to Win With Logic
Through years of research, trading and helping individual traders around the world. He learned that many traders have great trading ideas, but they lack one thing, they struggle to execute trades in a systematic way for consistent results. Chris helps educate traders with a three-hour video course that can change your trading results for the better.
His mission is to help his clients boost their trading performance while reducing market exposure and portfolio volatility.
He is a regular speaker on HoweStreet.com, and the FinancialSurvivorNetwork radio shows. Chris was also featured on the cover of AmalgaTrader Magazine, and contributes articles to several financial hubs like MoneyShow.com.


