US Stock Markets Could Rally Beyond Expectations


Late Sunday afternoon, President Trump surprised the global markets with the announcement of increased trade tariffs with China relating to the ongoing trade negotiations and delayed trade talks between the two global superpowers. The global markets reacted immediately upon the open Sunday night (Asian open). The VIX short position puts quite a bit of professional traders at risk of big losses today while those of us that were prepared for an increase in volatility and price rotation is poised for some incredible opportunities.
The US stock market is set up for a price move that will likely make many people very wealthy while frustrating many others over the next few months. We've recently posted many articles regarding the 2020 US Presidential election cycle and the fear cycle that comes from these major political events. In November 2016, we remember watching Gold rally $60 early in the election night, then fall $100 as news began reporting the surprise winner. There is so much capital, and future capital expectations that ride on these election cycles – it can actually drive the markets in one direction or another.
Right now, we have two things we want to alert you to regarding our proprietary Fibonacci price modeling utility. First, the current trend is Bullish and the chance of a downside price move is still valid. Remember, one of the primary price rules within Fibonacci price theory is that price must ALWAYS attempt to seek out new highs and new lows – at all times. This means that once price establishes new price highs, any failure to continue establishing new price highs, through standard price rotation, will result in its price attempting to establish new price lows.
So, as we continue with our expectations, remember that any failure of price to continue the push higher means it WILL rotate lower and attempt to establish new price lows.
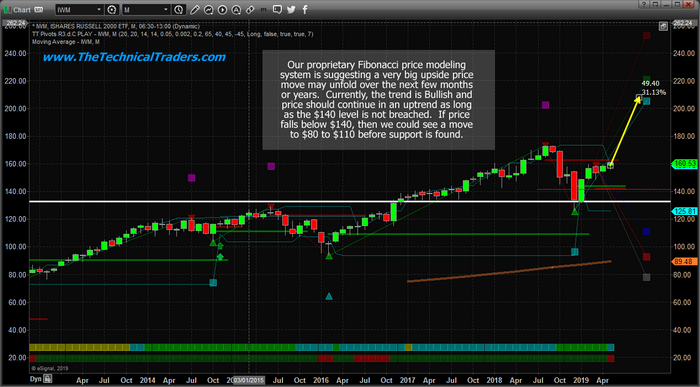
Taking a look at this IWM Monthly chart shows a very clear price rotation near the end of 2018 and that the current price has yet to rally above the October 2018 highs. In this instance, we have a FAILURE to establish new price highs within the current price move. We also have a new price low established in December 2018. This high and low sets up the range of $173.99 and $125.80. Fibonacci price theory tells us that PRICE WILL attempt to establish a new price high or new price low from within this range. Therefore, the price WILL either continue to rally higher and break the $173.99 level or price WILL reverse lower, without reaching the $173.99 level and target the $125.80 level.
Our modeling system is currently telling us that price and trend is bullish and that the current price level has clearly rallied above the Fibonacci price trigger levels near $143.50. Should price rotate lower and breach these Fibonacci price trigger levels, then we would expect the price to move much lower. Right now, we don't expect that to happen based on a strong US economy, employment and earnings.
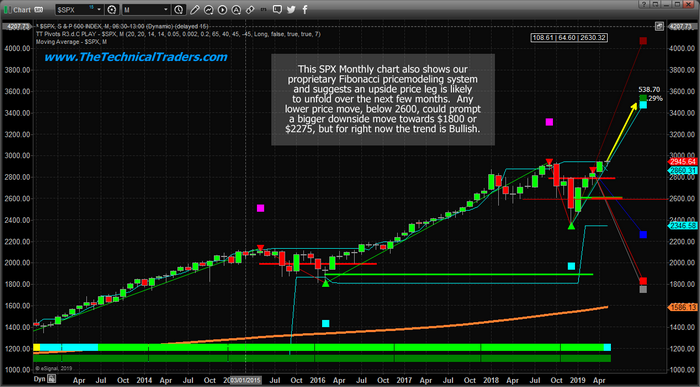
This Monthly SPX chart shows a similar setup – yet the main difference is that the current HIGH PRICES are clearly above the October 2018 previous highs. Thus, in this instance the SPX has reached “new price highs” as a component of Fibonacci price theory and, because of this fact, must continue to strive for new price highs or risk failing and rotating lower to establish new price lows.
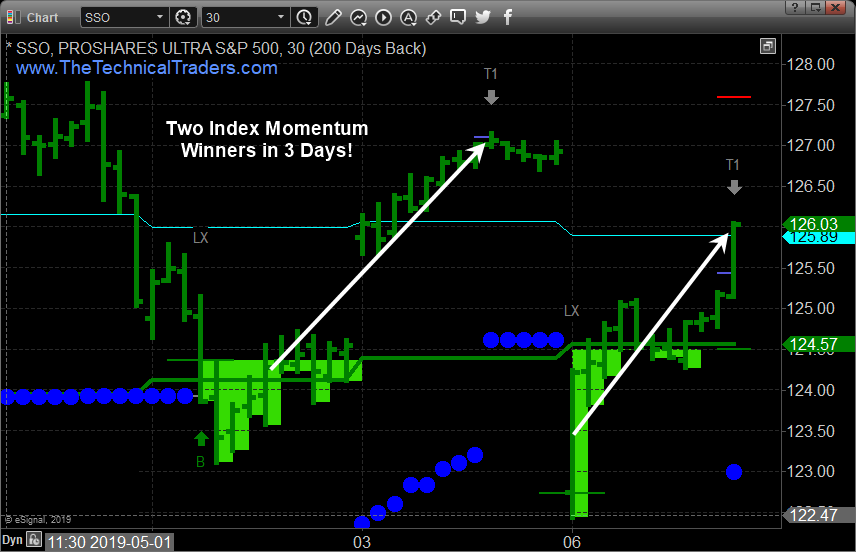
In fact, the past three trading sessions are proprietary SP500 index trading system issued two quick winning trades for members. The two trades pulled 2.5% and 2% out of the market in less than 24 hours from the entry prices. This momentum and trend trading system are going to be a new trading weapon for us to follow and trade the markets once we implement this into the member's area for viewing the charts and signals at any time.
Take a look at last weeks trade and today's trade which both hit T1 (Target 1).
Take a look at the chart below then consider what that last statement really means. It suggests that we have already reached into new price high territory. Fibonacci theory suggests that “once new price highs are established, the trend MUST continue to attempt to establish new higher price highs – OR FAIL and attempt to establish a new price low. Well, a failure at this level could mean a price move all the way back towards recent lows near December 2018 – near $2346.58. Therefore, it is critical that we see other markets, like the IWM, continue to push higher in an attempt to support this broader upside price move for all the US major stocks.
The most important factor going forward is to be prepared to think and react very quickly to price rotations, news, and the election cycle process. Take a look at how volatile the market has become over the past 12 months and consider the fact that we could continue to see this type of volatility in the markets for the next 15+ months – at least through the election cycle process.
Remember also that the US economy is operating on very strong fundamentals, employment, and outputs. Disruption of future expectations could lead to a massive displacement of capital in the global markets. Watch Oil, Gold, Silver and other commodities for any signs of weakness. And pay attention to the levels we are suggesting in this research post. If the SPX falls below $2600 – be prepared. If the IWM falls below $142 – be prepared. Price is always seeking out new price highs and new price lows. If it can't get one side, it will attempt to get the other.
The global market “Shake-out” that we wrote about weeks ago is just starting. Our expectations are that an increase in price volatility, as well as a minor price rotation, will take place in the US markets before a continued upside price bias will drive prices higher again. There are two main drivers that will become leaders of any bigger rotation in the global markets – Metals and Commodities. If we begin to see a collapse in commodity prices, pretty much across the board, while metals breakout into a rally, then we are setting up for a bigger downside price move. Until that happens, continue to expect an upside price bias to continue in the US stock market.
Secondly, should a massive currency revaluation event take place, where global currencies weaken as the US Dollar stays strong, then we could be setting up for a “slow unraveling” of foreign debt markets and foreign equity markets. This would be almost like a “slow bleed out” as a currency devaluation event prompt incredible pricing pressures on local foreign governments to support their economies. These devaluation events, if they happen, could prompt a hyper-inflation type of event that could disrupt weaker nations to such a degree that they could weaken world-leading economies that have exposure to these foreign nations – Think China/Russia.
Our advice continues to be to look for opportunities as the volatility increases and continue to expect an upside price bias in the US stock market – at least until we have any strong evidence that price trend has changed. Don't buy into the doom-sayers just yet. In our opinion, this US upside price move is not over yet.
If you want to become a technical trader and pull money from the markets during times when most others cannot be sure to join the Wealth Trading Newsletter today. Plus, for a few days only I'm giving away and shipping Free Silver Rounds to subscribers who join our select membership levels.
Chris Vermeulen
www.TheTechnicalTraders.com

Chris Vermeulen has been involved in the markets since 1997 and is the founder of Technical Traders Ltd. He is an internationally recognized technical analyst, trader, and is the author of the book: 7 Steps to Win With Logic
Through years of research, trading and helping individual traders around the world. He learned that many traders have great trading ideas, but they lack one thing, they struggle to execute trades in a systematic way for consistent results. Chris helps educate traders with a three-hour video course that can change your trading results for the better.
His mission is to help his clients boost their trading performance while reducing market exposure and portfolio volatility.
He is a regular speaker on HoweStreet.com, and the FinancialSurvivorNetwork radio shows. Chris was also featured on the cover of AmalgaTrader Magazine, and contributes articles to several financial hubs like MoneyShow.com.


