This Is What The Crude-Oil-To-Gold Ratio Says About Oil Now


Many times in the past, the relationship between gold and oil gave us valuable clues about crude oil future moves. Will the history repeat itself once again? What can we infer about the next gold move from the chart below?
Let’s examine the current situation in the oil-to-gold ratio to find answers to these questions.
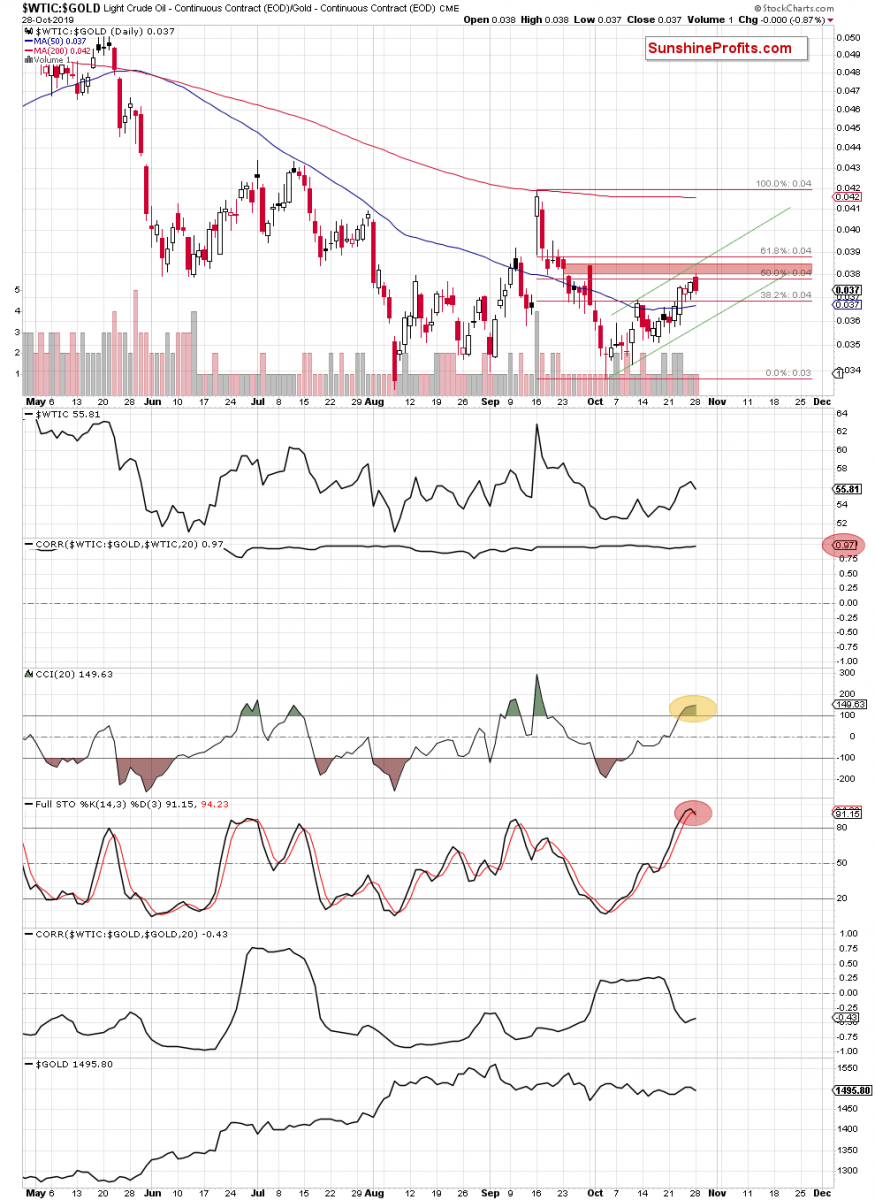
The daily chart shows that although crude oil-to-gold ratio opened yesterday’s session with a bullish gap, moving even higher after the markets’ open, the red gap created on September 24, 2019 stopped the bulls. It was the bears that took the reins in the following hours.
The ratio reversed and moved quite sharply lower, invalidating the earlier small breakout above the 50% Fibonacci Retracement. Additionally, the sellers formed a bearish formation on the above chart – the dark cloud cover pattern.
What do we know about this candlestick formation?
It usually appears at the end of the upward trend and precedes its reversal. Its first part is formed by a white candle. Then a black candle must appear on the market to complete the formation. What’s important, is that this candle should open above the close of the first candle, pointing to further buying pressure. And that’s exactly what has happened yesterday.
After that, the value/price of a given asset usually moves even higher, but the immediately following decline must be strong enough for the black candle to close below the midpoint of the white candlestick’s body. Such a shift from buying to selling suggests that reversal and further deterioration could be just around the corner.
Taking a closer look at the above chart, we see that yesterday’s close was below the above-mentioned level, which increases the probability of lower values of the oil-to-gold ratio in the very near future. This is especially so when we factor in the current situation in the CCI and the sell signal generated by the Stochastic Oscillator.
That’s all very nice but what does it mean for the price of black gold?
The correlation between the ratio and the price of the commodity is very strong (0.97), meaning that lower values of the ratio are highly likely to also translate into further deterioration in crude oil.
And that further deterioration in the ratio, what would it mean for gold?
The correlation between the oil-to-gold ratio and the price of yellow metal decreased significantly in the previous weeks, which means that forecasting the direction of the yellow metal based on this relationship is not a good idea. You will learn much more about the current situation in gold (and the whole precious metals sector) from our Gold Trading Alerts.
We hope you enjoyed reading the above free analysis, and we encourage you to read today's Oil Trading Alert - this analysis' full version. It discusses the daily oil price outlook, describing what exactly makes us open a new position and why. There's no risk in subscribing right away, because there's a 30-day money back guarantee for all our products, so we encourage you to subscribe today.
If you enjoyed the above analysis and would like to receive daily premium follow-ups, we encourage you to sign up for our Oil Trading Alerts to also benefit from the trading action we describe – the moment it happens. Check more of our free articles on our website – just drop by and have a look. We encourage you to sign up for our daily newsletter, too - it's free and if you don't like it, you can unsubscribe with just 2 clicks. If you sign up today, you'll also get 7 days of free access to our premium daily Gold & Silver Trading Alerts. Sign up for the free newsletter today!
Nadia Simmons
Forex & Oil Trading Strategist
Sunshine Profits - Tools for Effective Gold & Silver Investments
* * * * *
All essays, research and information found above represent analyses and opinions of Przemyslaw Radomski, CFA and Sunshine Profits' associates only. As such, it may prove wrong and be a subject to change without notice. Opinions and analyses were based on data available to authors of respective essays at the time of writing. Although the information provided above is based on careful research and sources that are believed to be accurate, Przemyslaw Radomski, CFA and his associates do not guarantee the accuracy or thoroughness of the data or information reported. The opinions published above are neither an offer nor a recommendation to purchase or sell any securities. Mr. Radomski is not a Registered Securities Advisor. By reading Przemyslaw Radomski's, CFA reports you fully agree that he will not be held responsible or liable for any decisions you make regarding any information provided in these reports. Investing, trading and speculation in any financial markets may involve high risk of loss. Przemyslaw Radomski, CFA, Sunshine Profits' employees and affiliates as well as members of their families may have a short or long position in any securities, including those mentioned in any of the reports or essays, and may make additional purchases and/or sales of those securities without notice.
********
More from Silver Phoenix 500


