Where Are Small Cap Stocks Headed?


Since December 24th, 2018, the small cap Russell 2000 has seen a nice rally. Our Purchasing Power Indicator caught almost all of it.
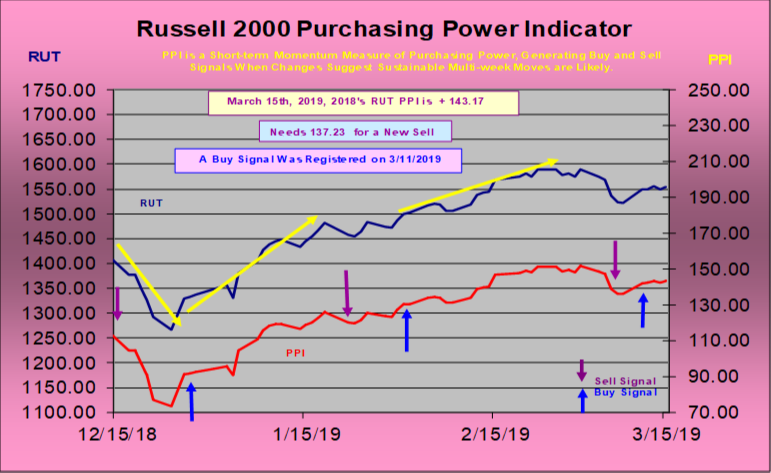
Our Russell 2000 Purchasing Power Indicator generated a new Buy signal on March 11th. Previous to this, Small caps rose sharply after our RUT Purchasing Power Indicator triggered a Buy signal on January 30th. Leading into the December 24th, 2018 decline, this amazing stock market trend turn identifier had signaled a Sell on December 4th, which led to a 10.2% decline in small caps. This has proven to be an excellent tool for market timers, or folks who want to dollar cost average their investments.
The Purchasing Power Indicator is a momentum indicator that tells us directional momentum is strong enough to follow through in that same direction. It is designed to avoid false breakouts, or is designed to identify high momentum reversals quickly after they occur so traders can adjust positions.
There is another indicator we developed and use to identify small cap stock market trend turns. This indicator is our Russell 2000, 10-day average Advance/Decline Line Indicator. It does two jobs for us:
First, it identifies when new rising or declining trends that are likely to be significant are starting, by triggering new Buy and Sell signals. A rise above positive + 180 is a Buy signal, telling us a rising trend is likely starting that is tradable or investable. A drop below negative -180 tells us the odds of a declining trend that lasts a while or is measurable is starting, giving traders and investors a signal to unload or lighten some small cap positions, or to reduce holdings in an Exchange Traded Fund such as IWM that closely tracks the Russell 2000. Aggressive market timer traders can also use this Sell signal to play the small caps to decline with put options or inverse ETFs.
But there is a second useful benefit to this 10-day average Advance/Decline Line Indicator. It can identify ahead of time, give us an early warning, of a coming trend turn a few weeks before it arrives. These warnings are when there is a divergence in the direction of the small cap Russell 2000 price index and its 10-day average Advance/Decline Line Indicator that is evident and growing over time.
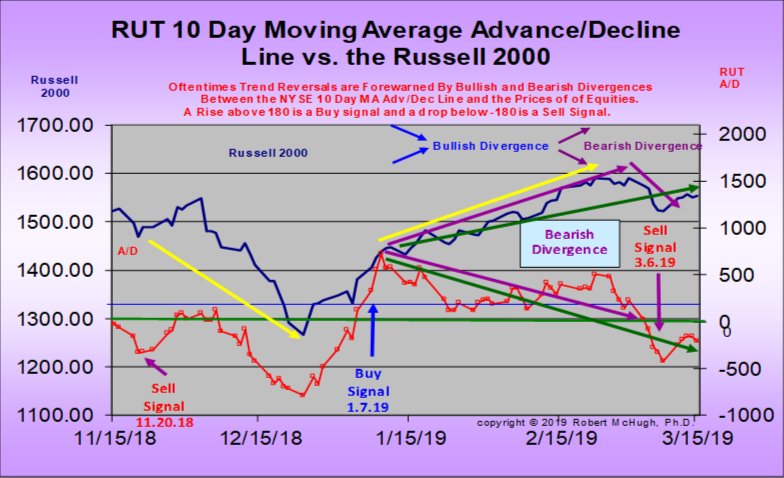
If the Russell 2000 is rising at the same time that its 10-day average Advance/Decline Line is declining, then we are being warning that a top is approaching. The larger the divergence, the greater the coming decline. In fact, this situation is evident right now, which is shown in the above chart. We are being warned that a top is approaching in small caps, and therefore the large size of this divergence suggests the subsequent decline could be large. This is telling us fewer stocks are participating in the rally. The rally is tiring.
There is also the scenario where the small cap Russell 2000 is declining, however the 10-day average Advance/Decline Line Indicator is rising. In this instance, when it occurs, we are being told that stocks are approaching a bottom that will lead to a nice rally. When this case occurs, it means fewer stocks are participating in the decline.
In the above chart, we see that the Buy signal on January 7th, 2019 told us a strong rising trend was starting. That has occurred. However, currently, we see that a large Bearish divergence is also occurring, and a recent Sell signal was generated on March 6th, both technical analysis measures warning that a trend turn down is close at hand, and it could be strong.
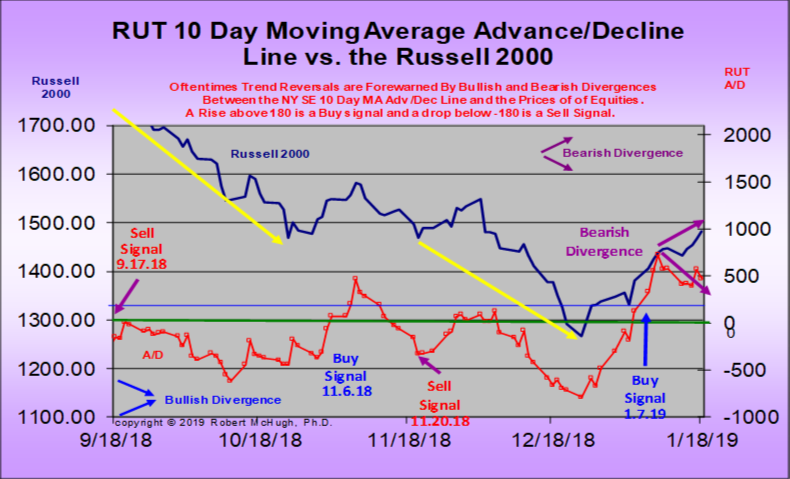
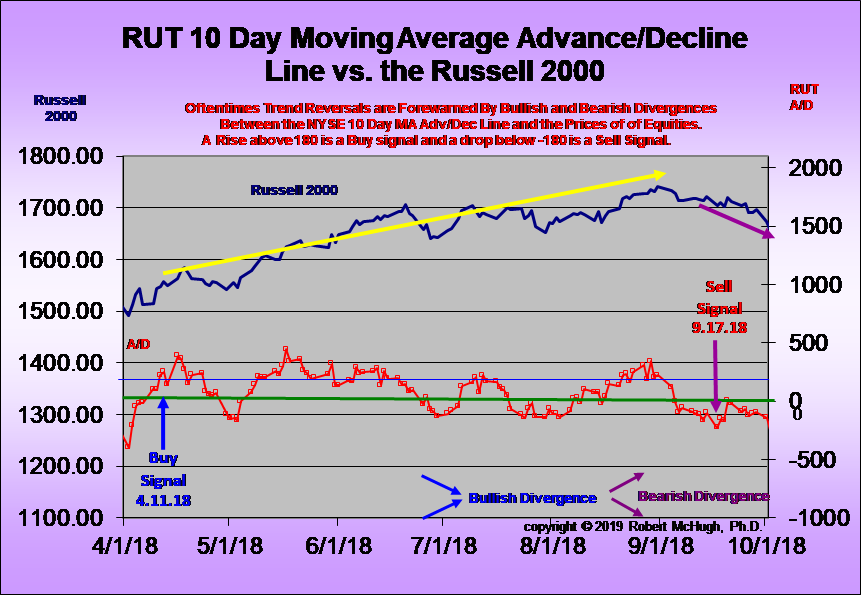
But how has this indicator performed in the past? Below are two chart snapshots from earlier in 2018. They show that the A/D Indicators did a very good job identifying the 2018 plunge in small caps with a Sell signal on September 17th, and again on November 20th. We also see that it caught almost the entire rising trend from April 2018 through September 2018 with a Buy signal on April 11th, suggesting that the new rising trend could be strong and tradable.
At McHugh’s www.technicalindicatorindex.com we have developed several proprietary indicators that help us identify when the next significant move is starting for small cap stocks, and in which direction the move will develop. We publish these indicators in every Daily Newsletter to subscribers. If you would like to subscriber to our newsletters, and receive these small cap indicators regularly, simply go to www.technicalindicatorindex.com and then click on either the Subscribe Today or Renew Today button, then select “Standard.” We also offer a Free 30 day trial subscription, available at the website by clicking the FREE Trial button at the upper right of the home page.
*********
More from Silver Phoenix 500


