Where the Dow, Gold, Silver & Oil Stand


Broad Market Trading Analysis
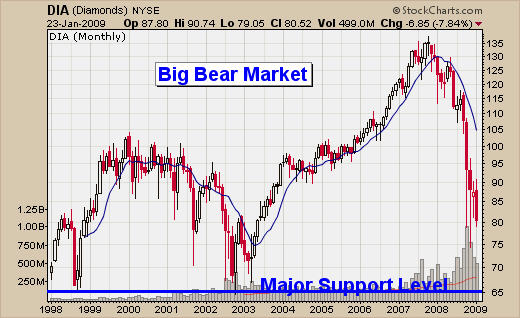
Last week the broad market slide lower on heavy volume as the DOW tries to hold the 8000 level. If this support level is broken then we could see another leg lower with the DOW sliding down to the 6500 level.
The reason I am mentioning this is because gold surged higher on Friday with big volume as traders start to anticipate this drop as well as the drop in the USD which is currently at a short term resistance level. If the market starts to drop, then holding gold stocks may not be the best safe haven. When the market sells off it tends to pull all stocks with it, by holding GLD fund or physical gold, SLV fund or physical silver, and the USO fund or physical crude oil, you could have better returns on your investment trading the commodity rather than going long stocks in a bear market.
Dow Index 10yr Monthly Chart - Explained
If you look at the monthly chart of the Dow Jones Industrial Average you can see that both of the previous bear markets back in 1998 and 2003 both bounced off the 6500 level before starting a new bull market. The Dow is currently at the 8000 level and looking very weak. I don't forecast prices but technically the market could break down and reach the 6500 within 1-2 months with our current level of volatility in the market and continued negative news with the tarp bailouts not working.
Dow Index (DIA ETF) Monthly Chart
The Daily Chart of the Dow Jones - Explained
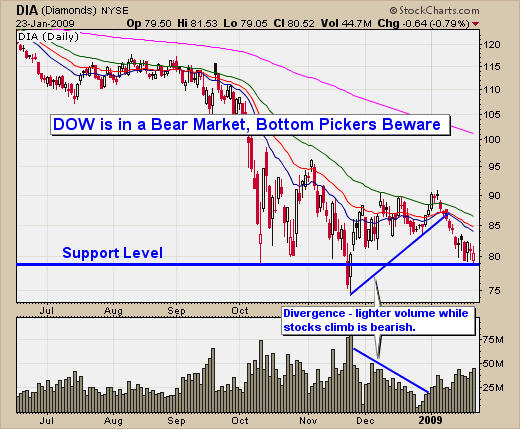
The daily chart of the Dow does not look so hot. Last month the Dow slowly climbed on lighter volume which is a bearish movement. Once the price was at the top of its short term trading range from the past month, sellers jumped in forcing stocks lower on increased volume. These are the characteristics of a bear market and long positions should be protected with stops or hedging which is what I mentioned a couple weeks ago in my report. Currently the daily chart is has sold down to support on increased volume and flirting with another major breakdown. What has me worried is that everyone things the market has bottomed, and if that's the case then all the buyers are long and a breakdown will trigger everyone's stops and margin calls will flood the market sending prices tumbling to new multi year lows.
Dow Daily Trading Chart (DIA ETF)
Dow Trading Conclusion
The broad market at this levels is very tempting to buy as dividend funds and stocks are priced to go out of business thus have big potential for the long term. My concern is that most people seem to think the markets had bottomed as of a week ago and if that's the case, everyone should be long right now. If the markets continue this downward slide a few more days we could see prices drop very quickly as I mentioned above. Either way prices for stocks are a steal at these prices and still a great deal if the market rallies another 10-15%. I would rather see the trend flatten more or start to head higher before I take long term trades to the long side. Please visit my website if you would like to receive my free weekly trading reports
Gold Trading Analysis
Spot gold prices soared on Friday as investors move their money into gold which is generally a safe haven during tough economic times and a US dollar which could drop sharply within the next 2-3 months.
Spot Gold Weekly Chart - Explained
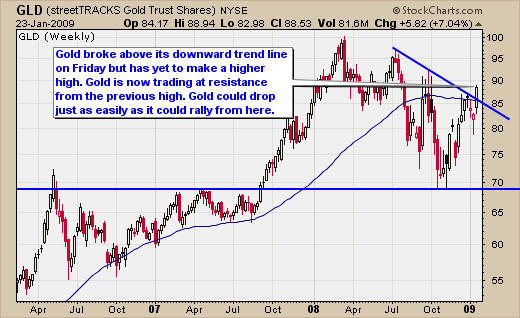
The weekly gold chart shows a very clear breakout to the up side of its current downward trend line. This chart looks to be strong its is important to note that it still has not made a new higher high, and is now trading at resistance of the previous short term top put in place last November. Gold could just as easily drop from here as it could rally.
Spot Gold Weekly Trading Chart
Spot Gold Daily Chart - Explained
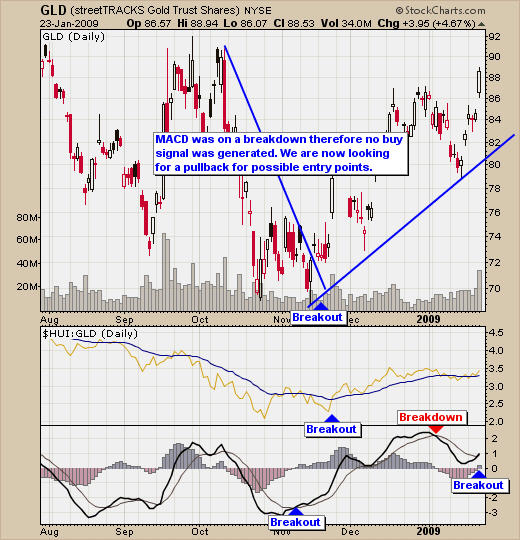
We did not have a buy signal last week because momentum was very strong to the down side on the daily chart. I only like to play reversals when we have momentum in our favor. That being said, momentum is now in our favor and we will be looking for a pullback for possible entry points now. On the daily chart the MACD was headed lower with a breakdown which is the main reason I was not willing to put our hard earned money to work. I do miss some nice moves if our funds but I make sure the odds will be in our favor before pulling the trigger.
Spot Gold Daily Chart (GLD ETF)
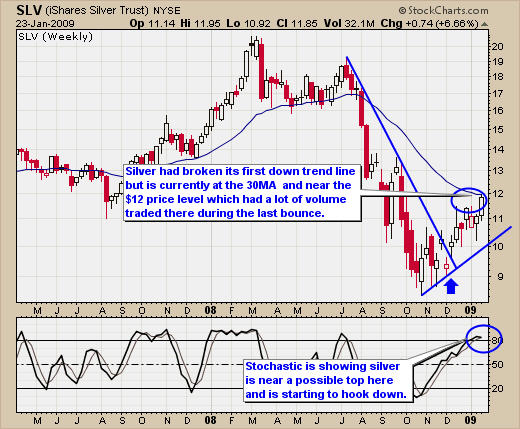
Silver Trading Analysis
Silver had the same things happening to it as gold did last week. MACD (momentum) was down and its risk was over 3%. We are now looking for entry points during a pullback.
Spot Silver Weekly Trading Chart (SLV ETF)
Gold and Silver Trading Conclusion
Gold and silver look like they have started a move higher as traders and investors put their money into something tangible which is a hedge against a falling dollar. I think these metals will perform much better than the gold and silver equities if the market does drop from here. That being said, if I get a buy signal for the equity funds I will take a position in them for sure. Waiting for a low risk trade with the odds in your favor is difficult but crucial if you want to succeed in the long term. Please visit my website if you would like to receive my free weekly trading reports
Crude Oil Trading Analysis
Crude Oil is something that I think has huge potential because of its prolonged down trend without any real bounces and because there is so much interest from traders and investors who want to catch this bounce. The weekly chart is starting to look amazing and the daily chart looks ready to pop as well.
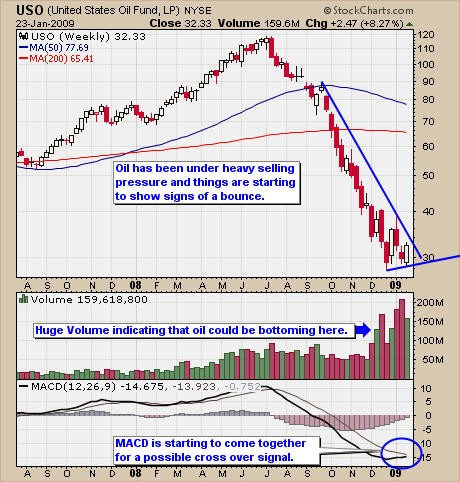
Crude Oil Weekly Trading Signal - Explained
The weekly oil trading chart shows a long 7 month sell off without any small bounces on the way down and volume has increased as the price slides lower indicating that there is more and more interest from traders and investors. Prices have now put in a small bounce and will be testing our downward trend line if price continue to rally this week. Also the MACD (momentum) is about to cross to the upside which is very bullish. If oil prices breakout above our down trend line and the MACD crosses over to the upside then we will have a buy signal in oil.
Weekly Crude Oil Trading Chart with Possible Oil Buy Signal
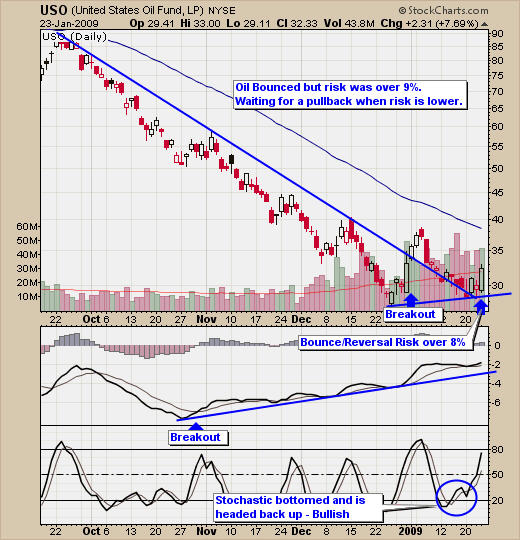
Crude Oil Daily Trading Chart - Explained
Crude Oil's daily chart is very bullish looking as well. The price has broken is downward trend line and has pulled back to a support level over the past 2 weeks. Fridays big bounce gave us a buy signal for USO because everything for my oil trading strategy was in favor (MACD cross, Stochastic, Trend line Break). The only issue was that risk was over 3%, it is currently at 9% and I will wait for a better entry point on a small correction.
Crude Oil Daily Trading Chart with Oil Buy Signal
Crude Oil Trading Conclusion
Crude oil as you can see looks to be a picture perfect setup as momentum in the price is slowly shifting direction. While many traders went long on Fridays buy signal I am waiting for risk to decrease before I put my money to work. I don't mind buying things at a higher price if the overall risk is lower and the reversal looks strong.

Chris Vermeulen has been involved in the markets since 1997 and is the founder of Technical Traders Ltd. He is an internationally recognized technical analyst, trader, and is the author of the book: 7 Steps to Win With Logic
Through years of research, trading and helping individual traders around the world. He learned that many traders have great trading ideas, but they lack one thing, they struggle to execute trades in a systematic way for consistent results. Chris helps educate traders with a three-hour video course that can change your trading results for the better.
His mission is to help his clients boost their trading performance while reducing market exposure and portfolio volatility.
He is a regular speaker on HoweStreet.com, and the FinancialSurvivorNetwork radio shows. Chris was also featured on the cover of AmalgaTrader Magazine, and contributes articles to several financial hubs like MoneyShow.com.


