Will 2014 Be Another 2008?


One of the biggest problems for the stock market entering 2014 was the near unanimous belief on Wall Street that stock prices would only go higher this year. Indeed, you had to look a long way to find even a hint of bearishness at the start of the year.
Just how bullish were investors before the decline began? According to Bloomberg Businessweek, advisers surveyed by the National Association of Active Investment Managers had 98.3 percent of their clients’ portfolios allocated to stocks in January before the decline began. By comparison, exposure to equities averaged 72 percent during 2013. It’s easy to see from this near-unanimity of belief in equities why the correction was bound to occur.
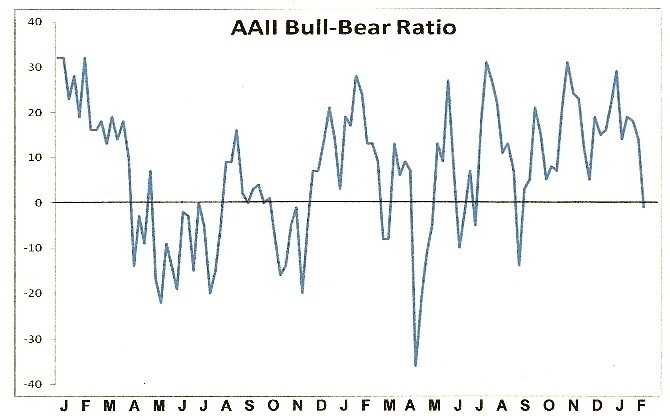
Even as recently as Jan. 30, investor sentiment according to AAII was evenly split between bulls and bears. Until this week there had not been a decisively negative bull-bear ration since Aug. 21, which underscores how relentlessly bullish the typical investor was. Recent sentiment readings are closer in line with what a short-term market low should look like, however, as finally many of those bulls have thrown in the towel.
From an intermediate-term standpoint, however, there are still a few too many bulls. The following graph depicts the AAII bull-bear ratio going back to 2012. The line should ideally plunge well below the “zero” point and fall deeply into negative territory to let us know that investors have completely thrown in the towel. From a contrarian standpoint this normally marks a solid intermediate-term turning point for the market.
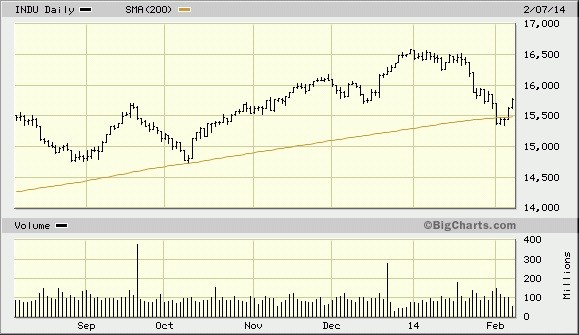
Yet another catalyst for the recent decline was the fact that the S&P500 Index (SPX), along with several other major indices, had pulled too far above from their 200-day moving averages. This signified an over-extended and technically overheated market in need of correcting. The SPX has pulled much closer in line to its 200-day MA in recent days, however. The Dow meanwhile has actually touched the 200-day MA and, after briefly slipping below it, is trying to re-establish support above it as you can see here.
Some have wondered if the recent correction was a warning of an even bigger decline to come later in the year. Along these lines I was recently asked the following question: “Based of the prior history of the 120-year bottom in conjunction with the concurrent bottoming of the various sub-cycles, do you have an expectation of the magnitude of the probable decline? The stock market declined about 58% basis the S&P500 into the early March 2009 low. Would the final down phase of these great cycles be expected to at least match that decline in intensity (at least on an inflation adjusted basis)? Or, because of QE, did the majority of the cyclical stock market decline this time occur during 2007-2009? The 50% off type of declines occurred in 2000-02 and 2007-09. Perhaps we have one final 50% off type of decline coming in the future.
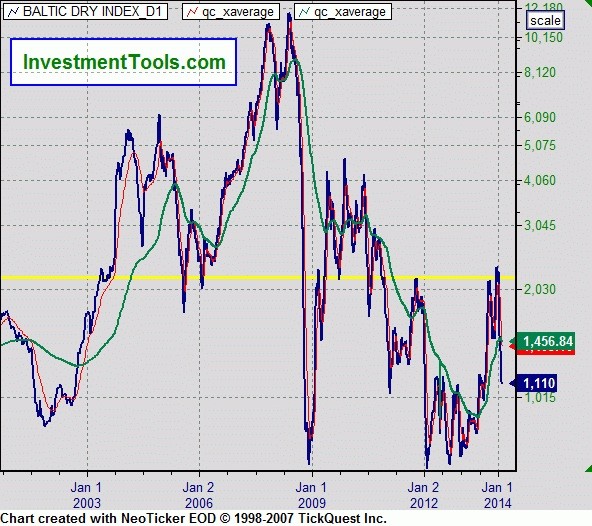
“The one index that truly crashed in 2008 which has not significantly recovered is the Baltic Dry Index. The May 2008 high was 11,793 and the low in December 2008 was 663. The past year's range was 735-2,337 with a recent reading around 1,700. The 2,000 level appeared to be resistance from 1985-2003. The 2,000 level might be a good indicator to focus on as representative of international trading and demand of certain commodities.”
My answer: Unfortunately there is no way of determining the magnitude of the decline associated with the Kress cycles. Bud Kress himself was always the first to caution that he couldn't be held responsible for magnitude; his primary concern was with direction. As he used to say, magnitude is the result of cycles + technicals + sentiment.
In holding to this formula, one can’t make a specific prediction about how low stocks may go before the 120-year cycle bottom is in later this year. It’s true that the severity of the decline during 2007-09 may have taken some of the downside potential away from this year's cycle bottom, just as the 1929-30 decline took much of the emphasis away from the 40-year cycle bottom of 1934. However, with the emerging markets (China in particular) a problem, we could see some serious spillover effects as the year progresses. I suspect it won't be as bad as 2008, but by the same token, 2014 will probably be much worse than what most Wall Street analysts are expecting.
As for the Baltic Index, this is an excellent barometer of the deflationary pressure being exerted by the bottoming 120-year cycle. If this correlation holds it will probably put in its final low by the end of the year.
********
Kress Cycles
Cycle analysis is essential to successful long-term financial planning. While stock selection begins with fundamental analysis and technical analysis is crucial for short-term market timing, cycles provide the context for the market’s intermediate- and longer-term trends.
While cycles are important, having the right set of cycles is absolutely critical to an investor’s success. They can make all the difference between a winning year and a losing one. One of the best cycle methods for capturing stock market turning points is the set of weekly and yearly rhythms known as the Kress cycles. This series of weekly cycles has been used with excellent long-term results for over 20 years after having been perfected by the late Samuel J. Kress.
In my latest book “Kress Cycles,” the third and final installment in the series, I explain the weekly cycles which are paramount to understanding Kress cycle methodology. Never before have the weekly cycles been revealed which Mr. Kress himself used to great effect in trading the SPX and OEX. If you have ever wanted to learn the Kress cycles in their entirety, now is your chance. The book is now available for sale at:
http://www.clifdroke.com/books/kresscycles.html
Order today to receive your autographed copy along with a free booklet on the best strategies for momentum trading. Also receive a FREE 1-month trial subscription to the Momentum Strategies Report newsletter.
Clif Droke is a recognized authority on Kress cycles and internal momentum, two valuable tools which have enabled him to call most major stock market turning points from 1997 through the present. He is the editor of the Momentum Strategies Report newsletter, published three times a week since 1997. He has also authored numerous top-selling books, including his most recent one, “Kress Cycles.” For more information visit www.clifdroke.com
More from Silver Phoenix 500


