Your Week Ahead: PMI, Payrolls, Ranges And Higher Volatility?


Thinking back to 2007 - 2008, I remember a time when the economic data just kept coming out rosy, even though I deeply suspected there was an underlying shoe to drop due to real estate and overlending. At the time, it seemed like every economic print was bullish, and the $SPX just kept climbing and climbing. It can be frustrating; when you may have the correct outlook, but just too early.
This concept is one of the most important things a trader can recognize; his or her timing. The market will dictate when you are right, and your wallet will reflect the harsh reality of when you are wrong.
With that being said, we turn our attention to the big data releases scheduled for June.
The Big One : Traders are looking to the Non-Farm Payrolls report on Friday, June 4th, at 8:30 AM ET. The market is expecting a gain of 645K - 670K here after last month's huge miss of 266K actual vs. 990K expected. Friday ought to be a doozy, with Fed Chair Powell speaking beginning at 7:00 AM ET and then the big jobs number.
But before we get to Friday, the ISM Manufacturing PMI is slated for release on Tuesday, June 1st, at 10:00 AM ET. This data will give market participants a view into business conditions, including employment, supplier deliveries, production, and more. This data release can be viewed as a precursor or clue to Friday’s Non-Farm Payroll Data. Then there is ISM Services PMI on Thursday. It is a big week for economic data releases in the US, with the granddaddy of all of them on Friday.
So, heading into the week, what is the S&P 500 telling us?
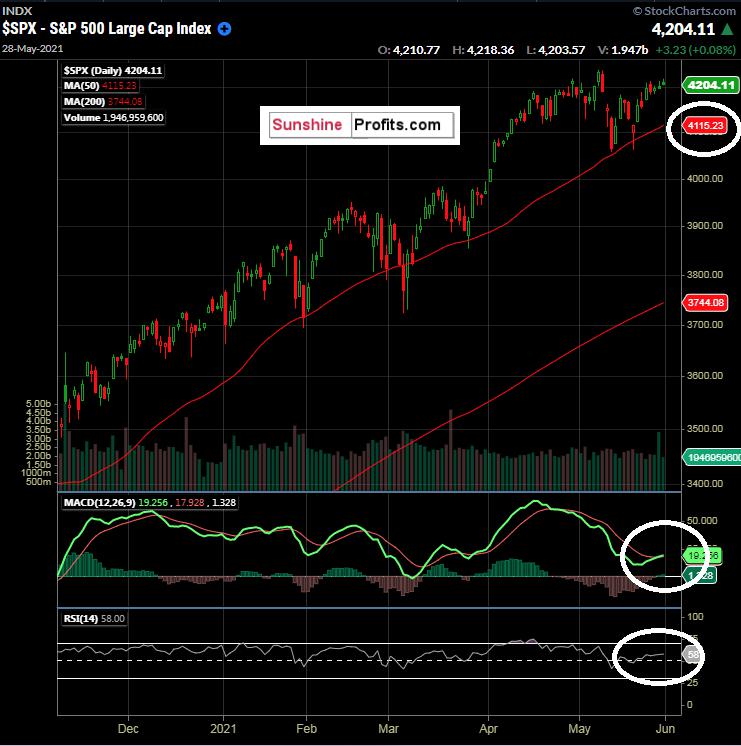
Figure 1 - $SPX S&P 500 SPX November 6, 2020 - May 28, 2021 Daily Candles Source stockcharts.com
There are several interesting things happening with the S&P 500. Coming out after a practically flat month of May (thanks to jobs data and inflation data), we see the MACD(12,26,9) throwing a bullish signal here, with the fast line crossing the slow line. RSI(14) is above 50, and we are currently trading well above the 50-day SMA of 4115.23.
While it may not seem logical, most signs seem bullish at this time, after a month of sideways trading and consolidation . One could reason that the jobs data and inflation that has been gaining steam should hurt the index. However, wouldn’t inflation make stocks more expensive too? It is something to think about. We have to keep a pulse on the US Dollar Index for clues.
What is happening in the $VIX ?
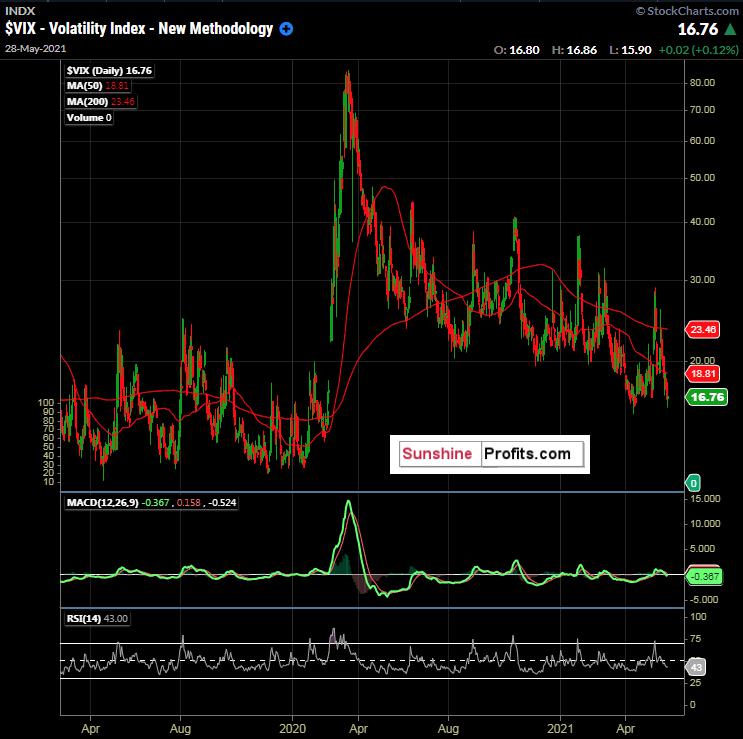
Figure 2 - $VIX Volatility Index 2000 ETF February 21, 2019 - May 28, 2021 Daily Candles Source stockcharts.com
There are no surprises here in the $VIX over the longer term. The massive spike caused by the pandemic has been steadily sold, with options sellers sucking up premiums akin to a vacuum cleaner. Although, there have been spikes along the way. Around the close on Friday, the $VIX caught my eye due to its close as the $SPX gave up around 10 handles between 3:00 PM and 4:00 PM ET.
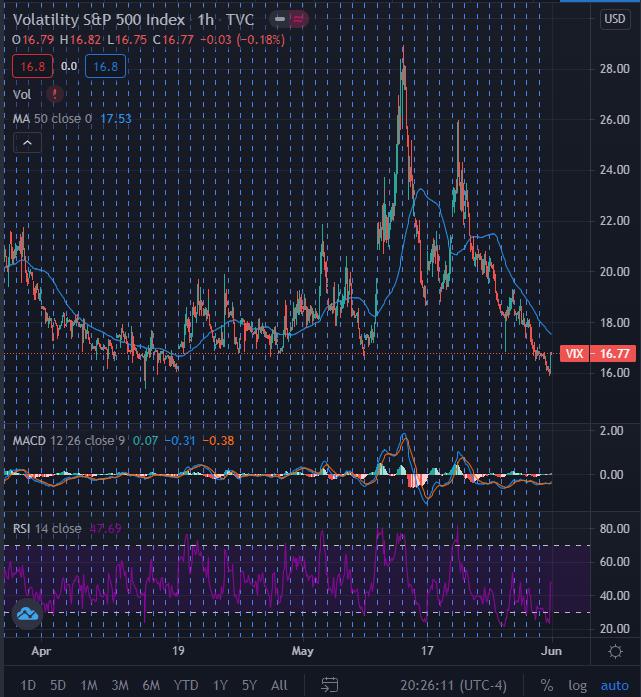
Figure 2 - $VIX Volatility Index 2000 ETF March 29, 2021 - May 28, 2021 Hourly Candles Source tradingview.com
The hourly candles show $VIX down near its April lows and catching a nice hourly pop on Friday near the close. Friday was the last day of the month, so there could have been some book squaring and month-end activity that contributed to the pop. It was nothing outrageous, but this action coupled with being near the bottom end of the recent range caught my attention.
There are some mixed signals for the S&P500 at the moment.
Since this week has so much data coming in, I would expect volatility to get bid up and options to become more expensive due to higher implied volatility. Given the flat month of May in the $SPX , I would view it as an overall bullish continuation pattern when factoring in the daily technicals. However, at the same time, the $VIX is near its lower end of the range.
Therefore, I am prepared for sideways trading in a wide range in the $SPX until the market gets a read on the NFP data.
Now, for our premium subscribers, let's further review the $SPX and the other markets and key levels that we are covering. Not a Premium subscriber yet? Go Premium and receive my Stock Trading Alerts that include the full analysis and key price levels.
Thank you for reading today’s free analysis. I encourage you to sign up for our daily newsletter - it's absolutely free and if you don't like it, you can unsubscribe with just 2 clicks. If you sign up today, you'll also get 7 days of free access to the premium daily Stock Trading Alerts as well as our other Alerts. Sign up for the free newsletter today!
Thank you.
Rafael Zorabedian
Stock Trading Strategist
Sunshine Profits: Effective Investment through Diligence & Care
* * * * *
This content is for informational and analytical purposes only. All essays, research, and information found above represent analyses and opinions of Rafael Zorabedian, and Sunshine Profits' associates only. As such, it may prove wrong and be subject to change without notice. You should not construe any such information or other material as investment, financial, or other advice. Nothing contained in this article constitutes a recommendation, endorsement to buy or sell any security or futures contract. Any references to any particular securities or futures contracts are for example and informational purposes only. Seek a licensed professional for investment advice. Opinions and analyses were based on data available to authors of respective essays at the time of writing. Information is from sources believed to be reliable; but its accuracy, completeness, and interpretation are not guaranteed. Although the information provided above is based on careful research and sources that are believed to be accurate, Rafael Zorabedian, and his associates do not guarantee the accuracy or thoroughness of the data or information reported. Mr. Zorabedian is not a Registered Investment Advisor. By reading Rafael Zorabedian’s reports you fully agree that he will not be held responsible or liable for any decisions you make regarding any information provided in these reports. Trading, including technical trading, is speculative and high-risk. There is a substantial risk of loss involved in trading, and it is not suitable for everyone. Futures, foreign currency and options trading contains substantial risk and is not for every investor. An investor could potentially lose all or more than the initial investment when trading futures, foreign currencies, margined securities, shorting securities, and trading options. Risk capital is money that can be lost without jeopardizing one’s financial security or lifestyle. Only risk capital should be used for trading and only those with sufficient risk capital should consider trading. Rafael Zorabedian, Sunshine Profits' employees, affiliates, as well as members of their families may have a short or long position in any securities, futures contracts, options or other financial instruments including those mentioned in any of the reports or essays, and may make additional purchases and/or sales of those securities without notice. Past performance is not indicative of future results. There is a risk of loss in trading.
*********
 After spending years as an active trader across several capital markets, Rafael earned his stripes as a former futures and options broker specializing in equity indices, energies, metals, and soft commodities. He prides himself on identifying potential opportunities that feature a "confluence of indicators". In addition to featuring a technically analytic approach, he is in tune with the macroeconomic themes that influence pricing across many markets. Rafael is the author of "Stock Trading Alerts" at Sunshine Profits.
If you want an excellent way to grab an edge over the market, stay up-to-date with analyses and the ability to reach out with any specific questions or updates you would like to see in future newsletters, then Sign-up is a few clicks away. Rafael looks forward to helping you on your journey through the markets.


