New Day, New Test Of The Great S&P500 Bull Run


Egged on by the horrendous retail sales data, S&P 500 intraday decline has gathered steam yesterday. An 8.7% drop in consumer spending can’t be just waved off. Neither can the Empire State Manufacturing Index at -78.2. We have the impression that the world is waking up to the realization that this downturn is going to be sharp. Do the stocks reflect that?
Let’s check yesterday’s price action in the S&P 500 (charts courtesy of http://stockcharts.com ).
These were our yesterday’s observations:
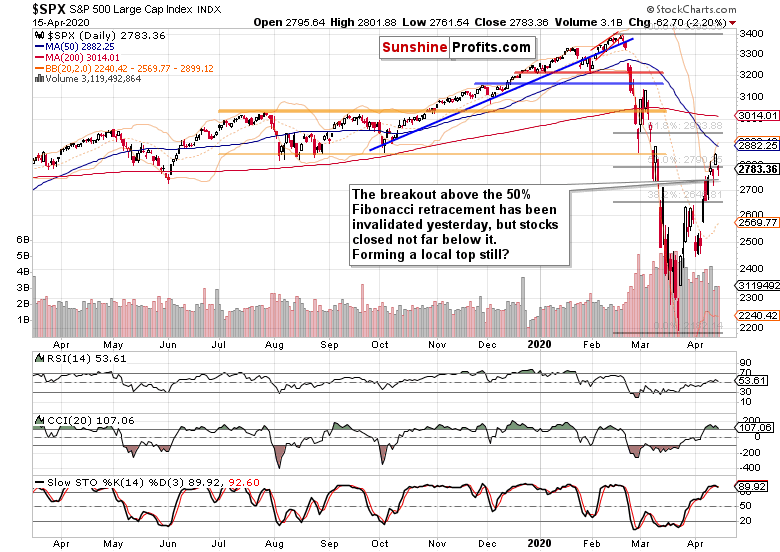
(…) Yes, stocks broke above the 50% Fibonacci retracement and closed darn near their intraday highs. But note the low daily volume. One can be easily forgiven when looking for a much higher one on such a key resistance breakout – expecting a higher reading is justified. Moves that happen on comparatively low volume, are best viewed with a healthy dose of suspicion.
We certainly didn’t see a bullish follow-through yesterday that would invalidate the above thoughts. Quite to the contrary – stocks moved back below the 50% Fibonacci Retracement and closed there. True, the bears suffered setbacks as yesterday’s lower knot shows. But does this make the outlook bullish and refresh the look of the daily indicators?
Well, Stochastics just flashed its sell signal. As it happened in its overbought territory, quite a few traders (us included) wouldn’t take it at face value, and would prefer to wait for the indicator to clear the overbought area first. CCI points to decreasing strength behind the stock upswing, and is on the verge of generating its own sell signal, while the RSI is struggling around its midline. Quite a bearish combination overall.
Let’s quote our Tuesday observation:
(…) It’s certainly true that quite a few tradable, sizable market moves start with a fake run in the opposite direction that ultimately burns itself out and reverses course. And this is what we’re likely witnessing these days in stocks as well.
(…) Regardless of the backing-and-filling that may come over the nearest days, another leg lower will come as surely as an increase in selling pressure.
And regardless of another 5245K newly unemployed Americans, it may very well turn out so. S&P 500 futures have shrugged off the number and turned higher in its wake. More than 21 million (yes, million) lost their jobs within the last 4 weeks. Paying people to sit at home and do nothing must do wonders for corporate profitability and GDP as the real economy springs back to life in one go, just like that. In short, the V-shaped recovery is a fantasy. We’ve discussed the disruptions in our Sunday’s special stock trading alert, and encourage you to read it if you hadn’t done so already.
How did the credit markets do yesterday? Let’s check one of the key ratios of their performance - high yield corporate bonds to short-dated Treasuries – and draw conclusions.
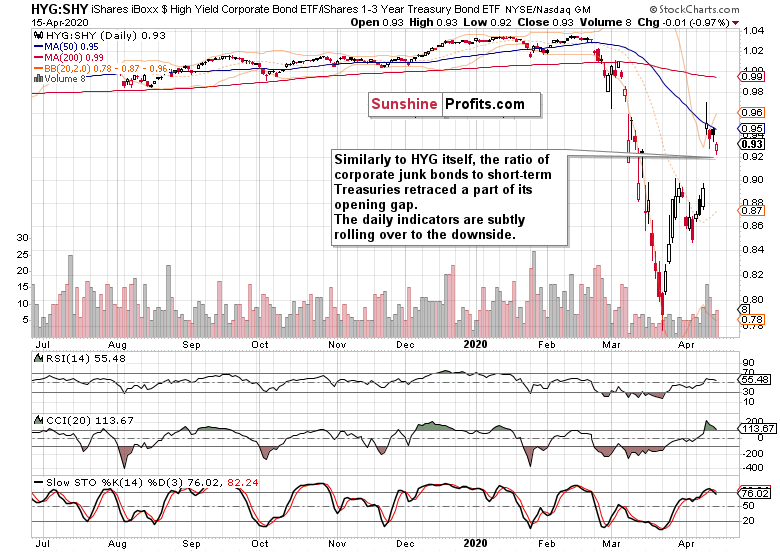
Mirroring the daily action in HYG ETF, the ratio opened lower and retraced part of its daily downside. Yet it closed clearly below yesterday’s closing value, and the daily indicators (Stochastics is on its sell signal now and CCI on the verge of flashing its own).
Taking Thursday’s bombshell Fed announcement as the starting point, this is a telling underperformance of the action in stocks. Therefore, stocks are likely to catch up with a downside move of their own, sooner or later. Most probably sooner rather than later.
As the S&P 500 trades below 2780 at the moment of writing these words, today’s session will likely show just how steadfast the bulls really are. Can they hope for a result along yesterday’s lines?
Summing up, while the stock bulls repelled part of yesterday’s downswing, they didn’t magically turn the outlook bullish. Tuesday’s breakout above the 50% Fibonacci retracement has been invalidated. Notably, the credit markets continue to underperform the S&P 500 action. The risk-reward ratio simply isn’t on the bulls’ side as dreadful economic data are hitting the markets on a daily basis. Sideways trading followed by renewed selling pressure taking on the March lows, is the optimistic scenario here. The medium-term outlook remains bearish, and the short position justified as stocks won’t likely keep disregarding weak incoming April and May data on retail sales, consumer confidence, employment, manufacturing or the GDP – let alone the Q1 earnings hit and lowered Q2 guidance as the lockdowns have started to really bite. Chicken are coming home to roost.
We encourage you to sign up for our daily newsletter - it's free and if you don't like it, you can unsubscribe with just 2 clicks. If you sign up today, you'll also get 7 days of free access to our premium daily Stock Trading Alerts as well as our other Alerts. Sign up for the free newsletter today!
Monica Kingsley
Stock Trading Strategist
Sunshine Profits - Effective Investments through Diligence and Care
* * * * *
All essays, research and information found above represent analyses and opinions of Przemyslaw Radomski, CFA and Sunshine Profits' associates only. As such, it may prove wrong and be subject to change without notice. Opinions and analyses were based on data available to authors of respective essays at the time of writing. Although the information provided above is based on careful research and sources that are believed to be accurate, Przemyslaw Radomski, CFA and his associates do not guarantee the accuracy or thoroughness of the data or information reported. The opinions published above are neither an offer nor a recommendation to purchase or sell any securities. Mr. Radomski is not a Registered Securities Advisor. By reading Przemyslaw Radomski's, CFA reports you fully agree that he will not be held responsible or liable for any decisions you make regarding any information provided in these reports. Investing, trading and speculation in any financial markets may involve high risk of loss. Przemyslaw Radomski, CFA, Sunshine Profits' employees and affiliates as well as members of their families may have a short or long position in any securities, including those mentioned in any of the reports or essays, and may make additional purchases and/or sales of those securities without notice.
********

Monica Kingsley is a trader and financial markets analyst. Checking dozens of charts daily, she integrates their messages with economics and in-depth experience. Trade calls and writing are her cup of tea as much as studies in market histories. Having been at the financial markets when the Great Recession arrived, she experienced many bull and bear markets - be it in stocks, bonds, gold and silver. https://www.monicakingsley.co


