Silver's Stagflation Trap: The Fed Is Paralyzed and the Supply Picture Just Got Worse


The FOMC meets this week facing the worst stagflation setup since 1973, while the structural supply picture quietly got worse in every direction that matters.
Silver pulled back from its $88.80 session high on March 10 to around $80–81 as of this writing. If you're watching that number and feeling uncertain, I understand the impulse. A 9% decline in a week invites doubt.
But the pullback has a specific, identifiable cause: the US dollar strengthened sharply following the Warsh nomination and FOMC hold expectations. When the dollar strengthens, silver's investment demand retreats. This is not a new dynamic. In Issue #7, I documented the same mechanism during the January-February correction when silver dropped from $121.64 to $64.14, and the structural fundamentals didn't shift by a single ounce. The dollar creates the dip. The fundamentals determine what comes after it.
What the research from the past week confirms is that the structural forces haven't eased. They've compounded. Three of the most important developments since Issue #9 have nothing to do with the dollar, and everything to do with why the supply-demand picture in silver continues to deteriorate.
There are 6 Deep Dives that I'm discussing in this week's premium Silver Catalyst issue, and in this free article, I'll discuss 3 of them.
The Stagflation Trap: The Fed's Worst Nightmare Is Now Observable Data
The Federal Reserve meets this week in what may be the most difficult policy meeting since the 1970s. Three data points released over the past week make its position effectively impossible.
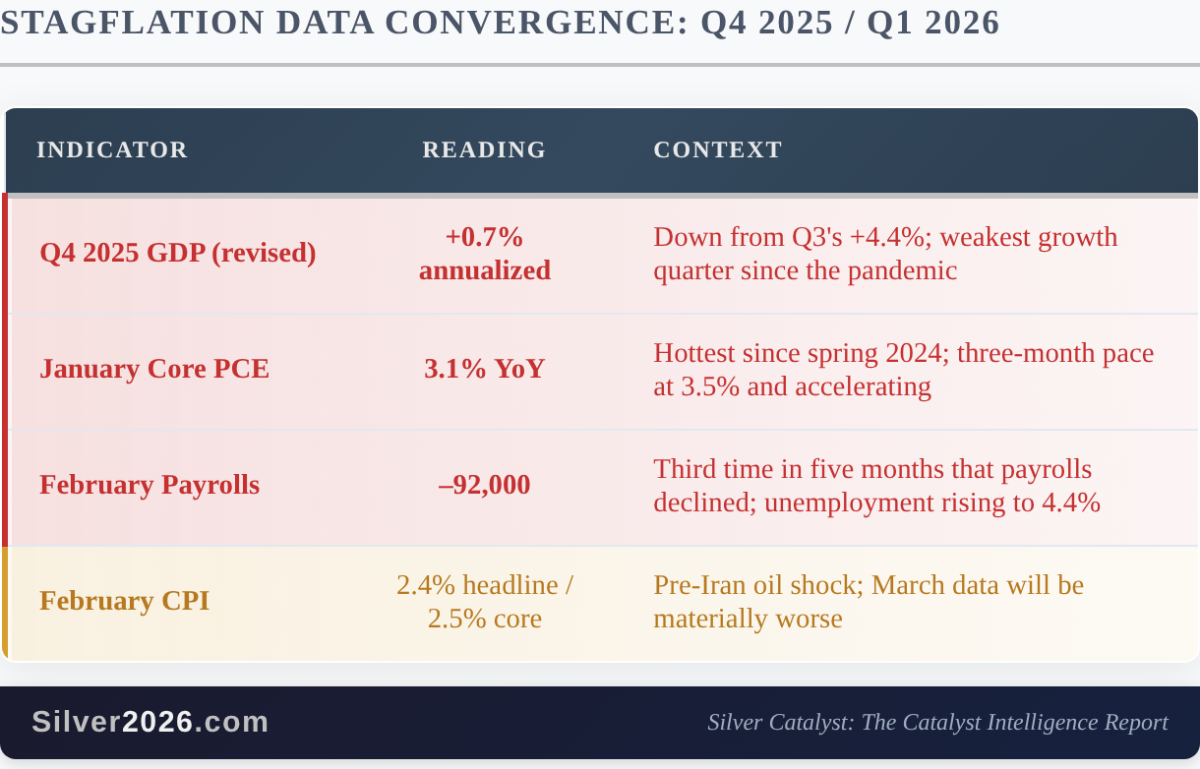
This is not a "soft landing" data set. GDP at 0.7% means the economy is barely growing. Core PCE at 3.1% (with the three-month annualized pace at 3.5%) means inflation is reaccelerating. February's –92,000 payroll print, the third decline in five months, means the labor market is deteriorating. And February CPI, the last print before the Iran conflict's oil price shock feeds through, is already the "calm before the storm" in analysts' own words.
The Fed cannot cut: that would pour fuel on a 3.1% Core PCE fire. It cannot hike: that would accelerate a labor market that is already shedding jobs. What it can do is hold, and watch real interest rates collapse as inflation runs above the policy rate.
That collapse in real rates is precisely the environment in which silver has historically delivered its most extreme performance. The 1973–75 stagflation episode saw silver rise substantially during recession. The 1979–80 oil shock produced the most extreme silver move of the modern era. The specific numbers I analyzed in "Silver Rising", over 40% during 1973–75 and a 713% surge across the 1979–80 episode, reflect a metal that responds to the combination of falling growth and rising inflation in ways that no other asset class replicates.
The conditions now are not identical to the 1970s. Supply deficits didn't exist then. Industrial demand was a fraction of today's. But the monetary transmission mechanism is the same: energy shock raises inflation, slows growth, paralyzes the Fed, and drives investors toward silver's dual role as both industrial necessity and monetary hedge.
The dot plot from tomorrow's FOMC may be the single most market-moving release for silver in the near term. Whether the median Fed projection shifts to zero cuts (hawkish, dollar-positive, temporary headwind) or two cuts (dovish, silver-positive) will determine the near-term direction. Either way, the stagflation setup that Catalyst #65: 1970s Stagflation Precedent Shows Extreme Performance anticipated is no longer theoretical. It's in the data, right now.
The Section 301 Investigation: 25% of Global Silver Supply Under Formal US Trade Review
On March 11–12, 2026, the US Trade Representative launched Section 301 trade investigations targeting 16 economies for alleged excess manufacturing capacity, explicitly including Mexico. A second investigation for alleged forced labor violations, also including Mexico, was released simultaneously.
Mexico produces approximately 200 million ounces of silver annually, representing roughly one-quarter of global mine supply. The investigation initiates a formal legal process that could lead to tariffs on Mexican goods. The public comment period closes April 15. The public hearing is scheduled for May 5. The USMCA review (covering roughly $1.8 trillion in annual bilateral trade) follows in July 2026.
The supply risk scenarios depend heavily on how far the investigation escalates. The following estimates model potential impacts on Western-accessible silver supply — direct data is not available, so these are informed guesstimates based on Mexico's ~200 Moz annual output:
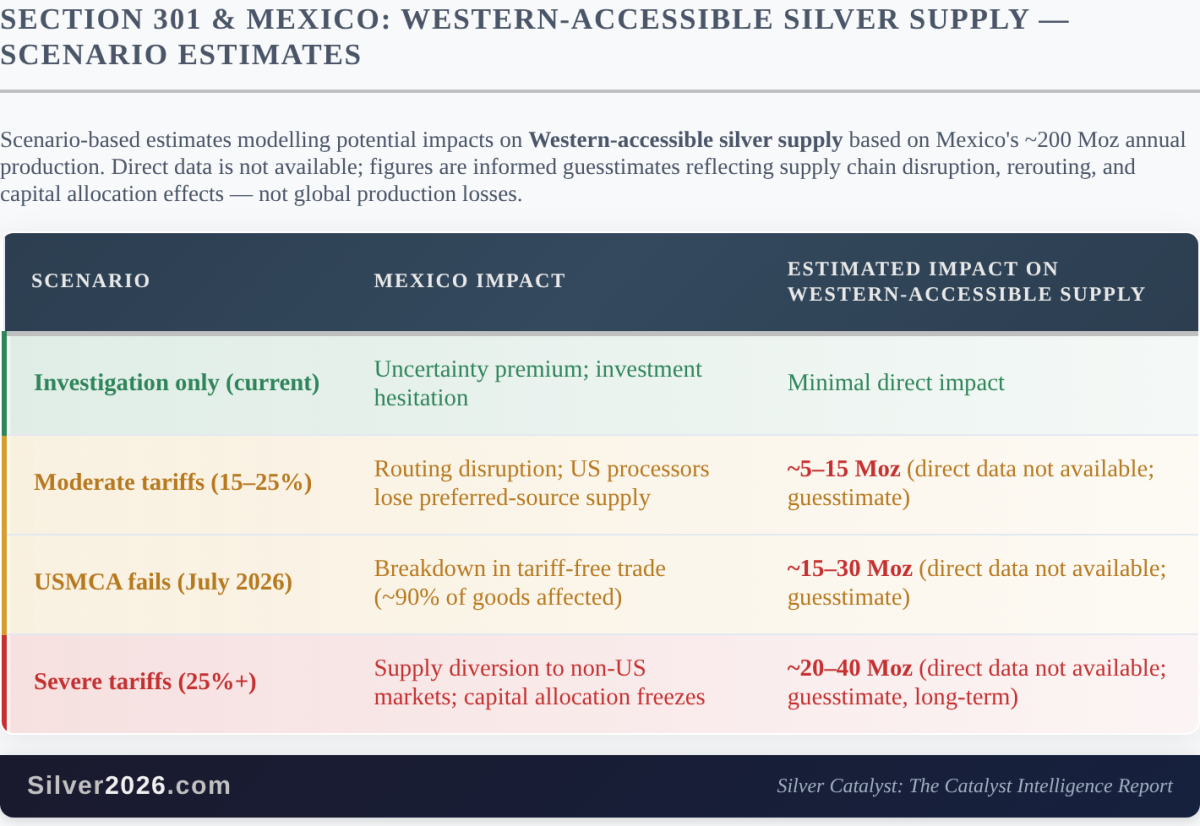
Mexico's regulatory environment for mining was already tightening before this investigation. The country implemented significant mining law reforms in April 2023 that restricted new concessions and tightened conditions for the sector. Fresnillo PLC, the world's largest primary silver producer operating entirely in Mexico, cut its 2026 guidance by 9% before any tariff effect. First Majestic Silver, also heavily Mexico-exposed, guided approximately 11% lower at the midpoint.
The arithmetic is direct. Mexico alone accounts for more silver production than the entire United States consumes in industrial applications annually. If trade tensions escalate to the point where that metal is diverted away from US-accessible refiners and dealers, the already-strained Western supply picture tightens further, on top of a sixth consecutive structural deficit already projected at 67 million ounces.
This is not a theoretical risk. It is an active federal investigation with a hard calendar: April 15 comment deadline, May 5 public hearing, July USMCA review. The supply disruption potential activates on a timetable, not a maybe.
The Supply Picture Gets Worse: Fresnillo, First Majestic, and the Geology That Doesn't Negotiate
The third development is quieter than stagflation or trade investigations, but in some ways more durable: the world's largest primary silver producers have cut their 2026 output guidance, and the reasons behind the cuts reveal a structural supply constraint that cannot be resolved by higher prices.
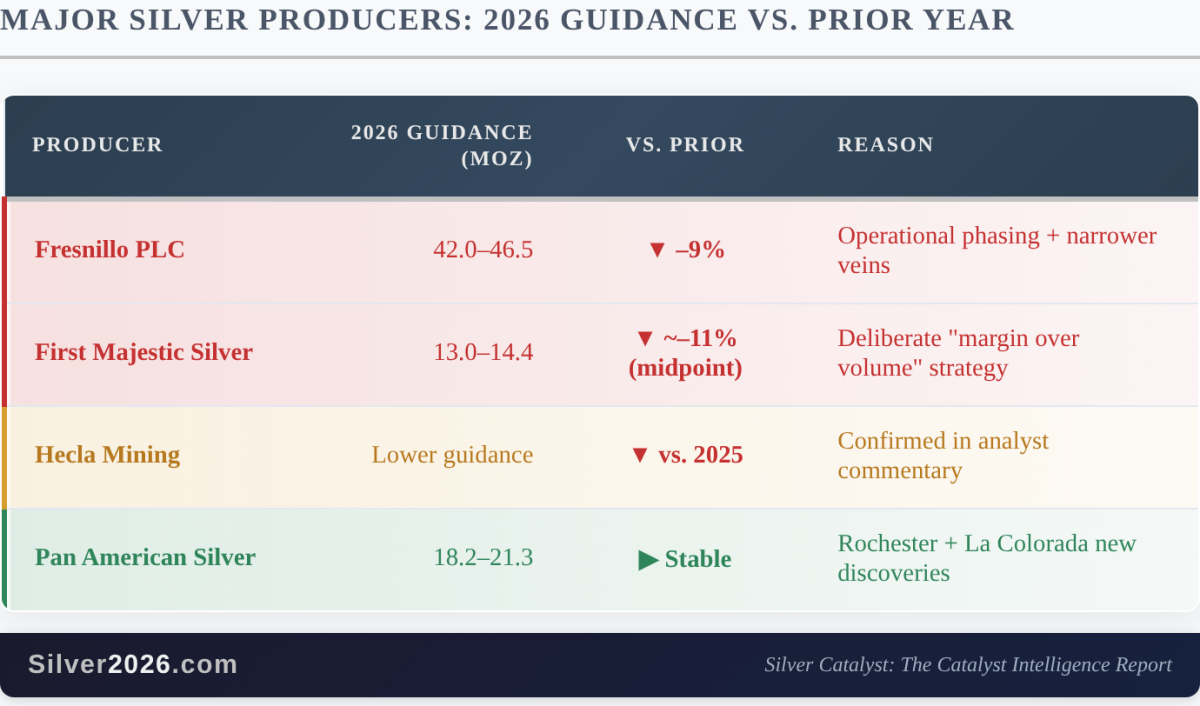
The combined documented shortfall from Fresnillo and First Majestic alone is approximately 5–6 million ounces at midpoints versus prior guidance. The consensus gap (comparing guidance against what the market had previously modeled) is considerably wider, with analysts estimating a 12–20 Moz shortfall from the top three primary producers versus expectations.
What makes these cuts structurally significant is the reason behind each. Fresnillo's 9% reduction is geological: mine plan changes driven by narrower veins and deteriorating ground conditions. This is Catalyst #5: Ore Grade Decline Creating Exponential Cost Increases from "Silver Rising" in live operation. You cannot drill ore grades back into existence. No price signal reverses the physics of a narrowing vein.
First Majestic's cut is different in character but equivalent in effect. The company is intentionally producing less silver because the economics of volume maximisation at elevated prices are inferior to the economics of extending mine life at higher margins. A well-run silver miner choosing not to produce more silver at $80/oz tells you something important: the company sees no better deposit to exploit, so it's managing the existing one for longevity rather than throughput. Either way, the market gets less metal.
The broader supply pipeline offers no relief in the near term. The South32 Hermosa environmental impact statement, filed March 5, required 140 additional conservation and mitigation measures, with a 45-day objection period now running. Even in the best case, meaningful production from that project is still a few years away. Despite higher silver prices, the global pipeline of new primary silver supply remains limited. Even where projects are advancing, timelines extend several years, and forecast production growth remains modest and insufficient to close the structural deficit (Silver Institute). The constraint is not the absence of projects, but the timeline: bringing new silver supply online typically takes more than a decade, meaning today's price signal cannot resolve a deficit that is already in its sixth consecutive year. And as I have been tracking throughout 2026, global mining exploration budgets declined in 2024 despite silver prices more than 150% above their year-ago level. The capital is not flowing back to primary silver development at the scale the deficit requires.
Above this, oil prices surged above $100 in March amid the Middle East escalation before settling back toward $85–90, still structurally higher than pre-war levels, adding approximately 8–12% to All-In Sustaining Costs for mining operations globally. At $80–81 silver with elevated energy costs, margins are tighter than headline prices suggest.
The supply picture that I analyzed in Catalyst #1: Peak Production Already Achieved and Catalyst #8: 15.7-Year Mine Development Timeline Preventing Supply Response is not easing. It is tightening on multiple fronts simultaneously.
What This Means
Three forces, each independent of the others, all pointing in the same direction.
The stagflation trap puts the Fed in the position of having to watch real rates fall even as inflation reaccelerates. This is the precise monetary environment that has historically driven silver's most extreme performance. The Section 301 investigation creates a formal supply disruption mechanism with a hard timetable, threatening to complicate access to the 200 million ounces Mexico produces annually. And the guidance cuts from Fresnillo, First Majestic, and Hecla confirm that primary silver producers cannot increase output even at $80+ silver. The geology limits how much additional supply can be brought online, and while higher prices would normally incentivize increased production, the structure of the silver market prevents a rapid response. Most silver is produced as a byproduct of other metals, and new primary supply takes years to develop, meaning today's price signal cannot quickly translate into higher output.
None of these three developments reduces the sixth consecutive structural deficit of 67 million ounces. None of them replenishes the 78.95 million ounces of COMEX registered inventory. None of them pushes back the April 1 date when India's mutual fund industry (managing nearly $1 trillion in assets) gains formal permission to allocate to silver for the first time.
Silver at $80–81 is not reflecting this. It's reflecting a dollar-driven investment demand withdrawal that has a specific, identifiable, and historically temporary cause.
The math doesn't change. The calendar keeps moving. And the structural forces keep compounding.
These three developments are already in motion. What matters next is how they converge.
The full Silver Catalyst Issue #10 breaks down the pressure building inside the COMEX system, the institutional shift now underway — including a new peer-reviewed study out of the University of Zurich that explicitly identifies silver as a beneficiary of the energy transition — and the next phase of demand that is beginning to emerge. That includes the FAA-approved eVTOL pilot programs, where early commercial deployments are already pointing to a new category of high-intensity silver use that did not exist at scale even a year ago.
This is where the timing and magnitude of the move become clearer.
If you want to see the full picture — and what it implies from here — you can access the complete analysis below:
Access the full Silver Catalyst Issue #10
*******
 Przemyslaw Radomski, CFA, is the founder, owner and the main editor of SunshineProfits.com.
More from Silver Phoenix 500


