Bonds And Related Indicators


TLT is now a buck from its target of 129. Tell me, where is all that mania about rising interest rates and the likes of the “R.I.P. Bond Bull Market” headlines (Bloomberg called the bottom almost to the day with that Louise Yamada hype). Now a mature bounce labors on. 129 does not need to stop the move, but it’s a long-standing marker, so…
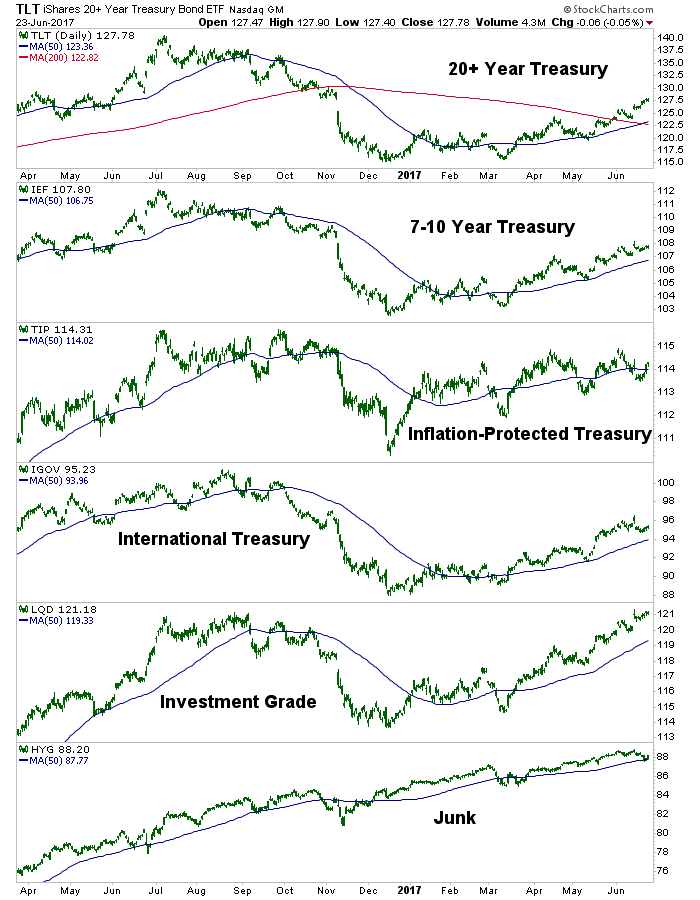
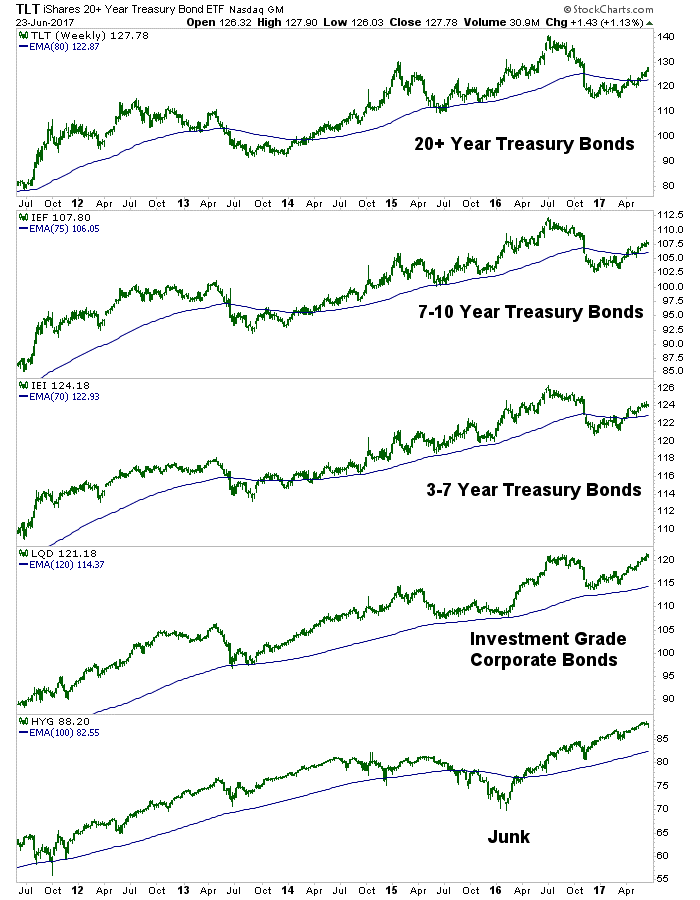
The weekly US bond view sees what could be a bullish Ascending Triangle in Investment Grade. A breakout to new highs would target 125 at a minimum. Junk, while still on a bullish long-term trend, needs a rest and the daily view above shows that when it rests it usually caves below the SMA 50. A real correction would bring it toward the weekly EMA 100 and would likely signal risk ‘off’ pressure to the stock market as well.
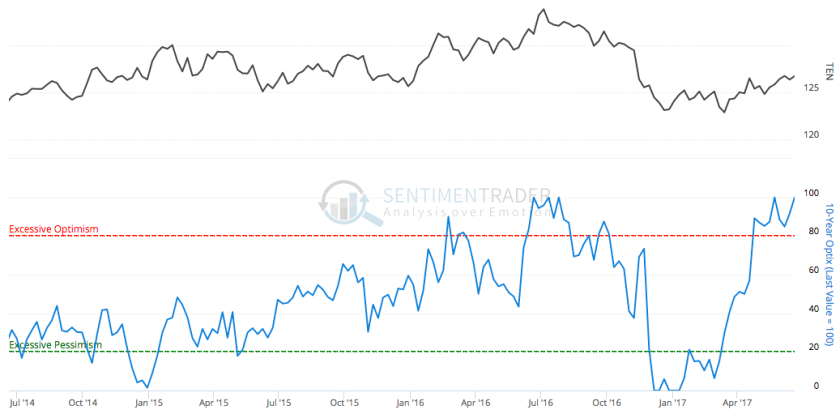
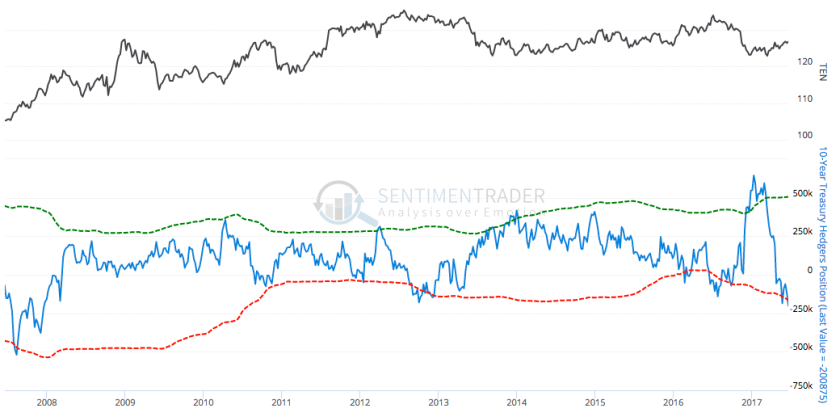
And the bearish sentiment and Commitments of Traders cases continue to build against the 10yr as optimism surged again in public opinion and commercial traders moved to their highest net short position on this cycle. As noted last week, the 30yr bond has also joined in the bearish sentiment/CoT festivities. Graphics courtesy of Sentimentrader.com:
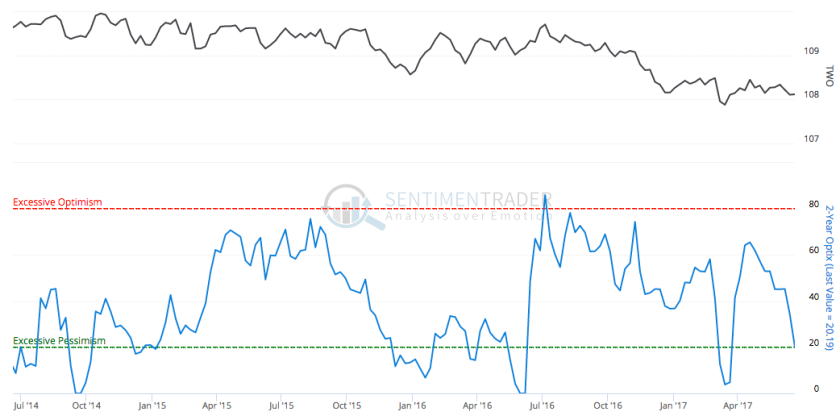
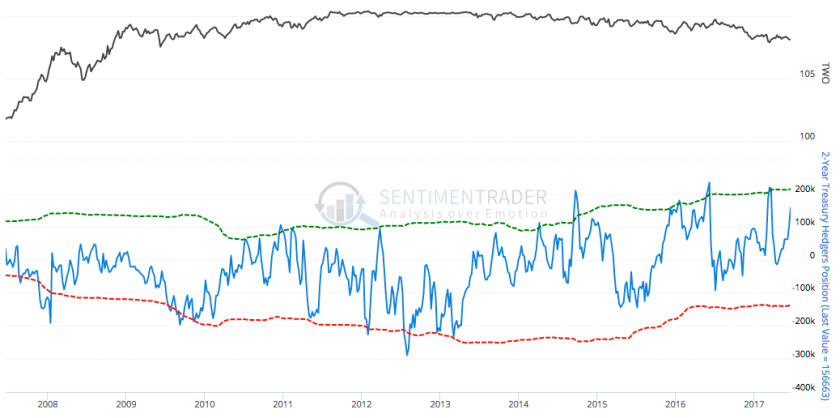
But now let’s consider the following public sentiment and Commercial hedging data on the 2yr note. Just as the two items above are moving to a contrarian bearish alignment on the 10yr bond they are moving toward a bullish alignment on the 2yr note. The theoretical implication of this? Rising long-term yields and declining short-term yields. The implication of that? A rising yield curve.
Take heed of the word “theoretical” here because I don’t want to be ringing alarm bells as someone with an agenda might. I simply want to illustrate that on a contrarian basis, bonds are moving toward an alignment that would imply a rising yield curve out ahead.
If the yield curve were to rise then eventually so too would either inflation expectations or the fear of systemic stress (like say, no longer benign deflationary pressure). That is why we note that gold favors a rising yield curve and hates a declining one; if it were to rise then either inflation would become a problem or systemic health and by extension, confidence in policy makers and the banking/financial system will.
As for inflation expectations, TIP/IEF bounced a bit last week but is firmly down trending. Again, we appear to be filling the ‘Trump’s gonna reflate to the high heavens!!!’ gap. [Last week] we showed the St. Louis Fed graphs for both Inflation Expectations and the Yield Curve and suffice it to say they are still pointing down right now.
For reference with the public version of this article we include a couple of updated graphs from NFTRH 452, courtesy of St. Louis Fed, which show the 10yr Breakeven Inflation Rate, an ‘inflation expectations’ gauge, and the 10yr Constant Maturity minus the 2yr Constant Maturity, a view of the Yield Curve.
Our view is that inflation expectations are declining to fill the ‘Trump Reflation Gap’…

…while the yield curve is under no obligation to invert before it bottoms, as most seem to believe.
Subscribe to NFTRH Premium for your 40-55 page weekly report, interim updates and NFTRH+ chart and trade ideas or the free eLetter for an introduction to our work. Or simply keep up to date with plenty of public content at NFTRH.com and Biiwii.com. Also, you can follow via Twitter @BiiwiiNFTRH, StockTwits, RSS or sign up to receive posts directly by email (right sidebar).


