Is this Complacency?


Charts created using Omega TradeStation 2000i. Chart data supplied by Dial Data
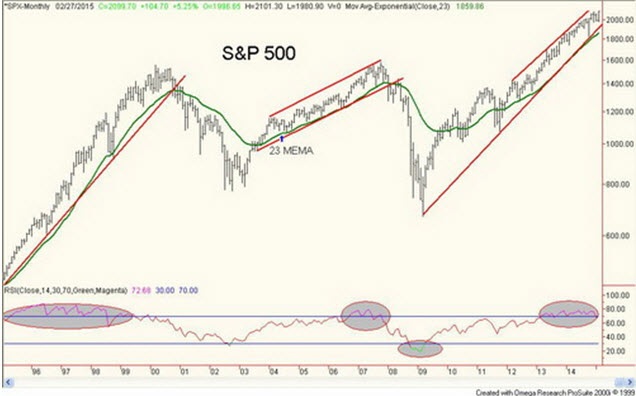
The S&P 500 made a new all-time high on February 18, 2015 closing over 2,100 for the first time. The NASDAQ also made new highs. The Dow Jones Industrials (DJI) and the Dow Jones Transportation (DJT) did not join the party. Maybe they will later.
Since the lows of March 2009, the S&P 500 and the US stock markets have been in a relentless rise to higher prices. Three rounds of QE, operation twist and an extended period of record low interest rates can do that for markets. The slope of the rise is not dissimilar to the bubble stock market rise of 1994-2000. That one also rose to record heights on a sea of low interest rates and liquidity even though interest rates were higher than seen today. There was also no QE during that period but there was a rapidly expanding money supply.
The 1994-2000 market rose 250%. By comparison the current market is only up 215% to date. The 1994-2000 market was interrupted by a 22% correction in 1998. The current market was interrupted by a just under 22% correction in 2011. The 1998 correction came later in the six-year bull while the 2011 correction came early in the current six-year bull. Neither bull market qualifies as the greatest six-year bull market ever. The 1923-1929 bull gained 344% (DJI) while the 1990-1998 bull (DJI) was up 295% (DJI). I chose the 1994-2000 bull that included the 1998 correction as its slope is more similar to the current bull then the 1990-1998 bull was. The 1994 correction was quite shallow.
The Forecast 2015 (Technical Scoop – January 8, 2015) noted that years ending in 5 have a strong record of being up years. As well, 2015 is a pre-election year and the stock markets are normally quite strong in pre-election years. Forecast 2015 noted there was potential for a blow-off but if it occurred it most likely would happen in the first quarter of the year. Could the breakout on the charts for the S&P 500 this past week be the start of a blow-off? It’s possible. The projected objective is up towards 2,100.
It should be noted that the S&P 500 is not the only stock market that has been on a tear since the lows of the 2008 financial crash. European and Asian stock markets have also been rising. Despite all of the problems in Europe, the German DAX, the Paris CAC and London FTSE have all recently made new all-time highs. The Tokyo Nikkei Dow just made new highs although that index remains down over 50% from its all-time highs seen in 1990. The Shanghai Stock Exchange (SSEC) recently made new highs as well.
So how can it be that when the Euro zone for the most part is in recession or at best tepid growth, Japan has been in a recession and China has been slowing down and even the US’s economic performance has been tepid at best that stock markets continue to make new highs? All countries have followed a mostly similar blue print in an attempt to bring their economies out of the recession that came because of the 2008 financial crash. Abnormally low interest rates coupled with QE have for the most part done the job.
But there has been a problem with this. Consumers for the most part were already tapped out. In the US mortgage loans have actually declined since 2009 with the major debt growth coming from government. Banks tightened their lending requirements and the result was that fewer qualified for loans. The result has been that instead of the funds from QE finding their way into the economy it has instead been used by the financial institutions for speculation in the stock market or purchasing foreign debt. Since the financial crash of 2008, global debt has soared by $57 trillion. While much of it has been government debt, consumers and corporations have played a significant role as well particularly in China. Global debt to GDP has soared to 286% from 246% in 2000.
Much has been made about all the jobs created since the financial crash of 2008 and the recession that followed. While the numbers suggest that there has been job growth the number of people working part-time has grown. The number of part-time workers has soared in the US since the 2008 financial crash and recession even though it is down from the peak seen in 2010. The data is, however, a hodge podge because it defines part-time workers as those who do not work 35 hours per week. If one holds two or three part-time jobs they could in theory be over 35 hours per week and therefore be considered full-time employees. In Canada, for example it is estimated that upwards of 1/3 of workers are holding down part-time jobs. Irrespective given that median incomes in both Canada and the US has barely budged in years it suggests that many are in low wage jobs with most likely little or no benefits.
In the US, the participation rate has fallen over the past several years. A falling participation rate helps to lower the headline unemployment rate. In the US, the headline unemployment rate (U3) is reported as 5.7% but when one takes into consideration part-time workers seeking full-time work and the long-term unemployed under one year the unemployment rate leaps to 11.3% (U6). That is a number that is more reflective of the real situation in the economy. Prior to the financial crash of 2008 and recession, this number rarely exceeded 9%. It topped out at over 17% in 2010.
John Williams of Shadow Stats www.shadowstats.com has one more unemployment number. The Shadow Stats unemployment rate takes into consideration the U6 number plus discouraged workers unemployed beyond one year that were defined away as not a part of the labour force in the 1990’s under the Clinton administration. Currently that number stands at 23.2%. It has actually gone up even as U3 and U6 have declined. The US labour force is actually smaller today than it was in 2000 (148 million vs. 153 million) even as the US population has grown from 280 million to 320 million.
A huge question mark hangs over Greece and its future in the EU and use of the Euro. Germany has rejected Greece’s request for extensions. What the next step is here is anyone’s guess. While many are trying to prepare for the possibility of the “Grexit” no one knows for sure how messy things might become. There remains fears of contagion in the Euro zone with Italy, Spain, Portugal and Ireland all of who are also under severe austerity with high unemployment and social unrest.
There has also been a series of competitive devaluations. Switzerland has already moved to negative interest rates and the Scandinavian countries have now joined them. Competitive currency devaluations are a form of the “beggar thy neighbour” policies of the 1930’s that contributed considerably to the Great Depression.
High unsustainable debt levels, threat of the “Grexit”, tepid growth in the western economies, competitive currency devaluations, a slowing China and of course one cannot ignore the ongoing war in the Mid-East and Ukraine despite the Minsk accords that have for the moment put the Ukraine war on the sidelines. Yet the stock markets keep going higher. The bulls call it “climbing the wall of worry”. The bears say that when the breakdown comes it could be swift. Stock market sentiment remains at or near record territory. The Investor’s Business Daily Advisor’s Survey is currently over 80%. It has been bouncing back and forth roughly between 70% and 80% since 2013. This suggests a market that is seeing high complacency.
The S&P500 has been in a rising bull channel since 2009. The top of the channel is currently just over 2,200. The bottom of the channel is currently just under 1,950. A blow-off could take the S&P 500 to the top of the channel. But if the bottom of the channel were to breakdown investors could quickly be consumed by a breakdown not dissimilar to either 2000-2002 or 2007-2009 or even 1923-1929. After a six year bull market, odds are the stock markets are getting closer to the breakdown stage even if the blow-off is seen first.
********
Copyright 2015 All rights reserved David Chapman
General Disclosures
The information and opinions contained in this report were prepared by Industrial Alliance Securities Inc. (‘IA Securities’). IA Securities is subsidiary of Industrial Alliance Insurance and Financial Services Inc. (‘Industrial Alliance’). Industrial Alliance is a TSX Exchange listed company and as such, IA Securities is an affiliate of Industrial Alliance. The opinions, estimates and projections contained in this report are those of IA Securities as of the date of this report and are subject to change without notice. IA Securities endeavours to ensure that the contents have been compiled or derived from sources that we believe to be reliable and contain information and opinions that are accurate and complete. However, IA Securities makes no representations or warranty, express or implied, in respect thereof, takes no responsibility for any errors and omissions contained herein and accepts no liability whatsoever for any loss arising from any use of, or reliance on, this report or its contents. Information may be available to IA Securities that is not reflected in this report. This report is not to be construed as an offer or solicitation to buy or sell any security. The reader should not rely solely on this report in evaluating whether or not to buy or sell securities of the subject company.
Definitions
“Technical Strategist” means any partner, director, officer, employee or agent of IA Securities who is held out to the public as a strategist or whose responsibilities to IA Securities include the preparation of any written technical market report for distribution to clients or prospective clients of IA Securities which does not include a recommendation with respect to a security.
“Technical Market Report” means any written or electronic communication that IA Securities has distributed or will distribute to its clients or the general public, which contains an strategist’s comments concerning current market technical indicators.
Conflicts of Interest
The technical strategist and or associates who prepared this report are compensated based upon (among other factors) the overall profitability of IA Securities, which may include the profitability of investment banking and related services. In the normal course of its business, IA Securities may provide financial advisory services for issuers. IA Securities will include any further issuer related disclosures as needed.
Technical Strategists Certification
Each IA Securities technical strategist whose name appears on the front page of this technical market report hereby certifies that (i) the opinions expressed in the technical market report accurately reflect the technical strategist’s personal views about the marketplace and are the subject of this report and all strategies mentioned in this report that are covered by such technical strategist and (ii) no part of the technical strategist’s compensation was, is, or will be directly or indirectly, related to the specific views expressed by such technical strategies in this report.
Technical Strategists Trading
IA Securities permits technical strategists to own and trade in the securities and or the derivatives of the sectors discussed herein.
Dissemination of Reports
IA Securities uses its best efforts to disseminate its technical market reports to all clients who are entitled to receive the firm’s technical market reports, contemporaneously on a timely and effective basis in electronic form, via fax or mail. Selected technical market reports may also be posted on the IA Securities website and davidchapman.com.
For Canadian Residents: This report has been approved by IA Securities, which accepts responsibility for this report and its dissemination in Canada. Canadian clients wishing to effect transactions should do so through a qualified salesperson of IA Securities in their particular jurisdiction where their IA is licensed.
For US Residents: This report is not intended for distribution in the United States.
Intellectual Property Notice
The materials contained herein are protected by copyright, trademark and other forms of proprietary rights and are owned or controlled by IA Securities or the party credited as the provider of the information.
Regulatory
IA Securities is a member of the Canadian Investor Protection Fund (‘CIPF’) and the Investment Industry Regulatory Organization of Canada (‘IIROC’).
Copyright
All rights reserved. All material presented in this document may not be reproduced in whole or in part, or further published or distributed or referred to in any manner whatsoever, nor may the information, opinions or conclusions contained in it be referred to without in each case the prior express written consent of IA Securities Inc.
More from Silver Phoenix 500


