Get Ready, The S&P500 Leg Higher Is Getting Underway


Wednesday and yesterday are two uneventful doji days. Wrong! The quiet breakout above the mid-June highs just got confirmed, meaning that the S&P 500 is primed to go higher eventually, I think. And in today's analysis, I'll lay out the case why it's only our patience that is getting tested here.
S&P 500 in the Short-Run
I’ll start with the daily chart perspective (charts courtesy of http://stockcharts.com ):
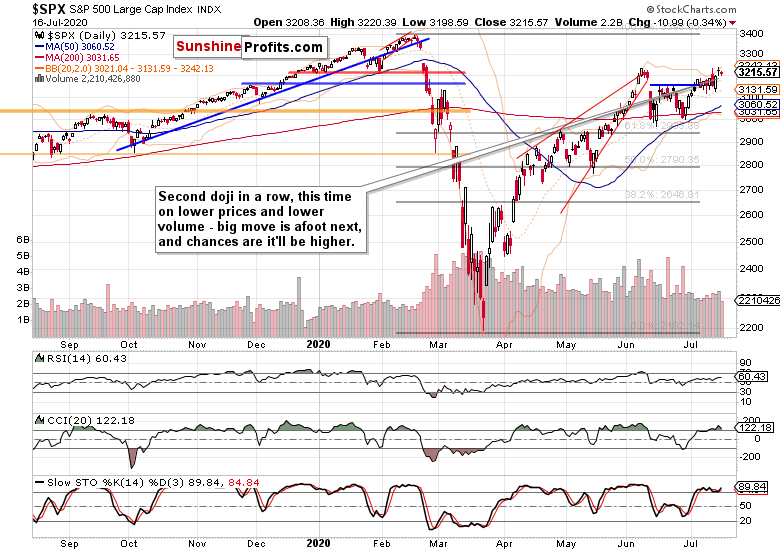
S&P 500 didn't get pretty much anywhere yesterday, but the third daily close above the blue resistance marks its turn into a support now. Decreasing volume of yesterday's lower close is also a slightly bullish omen in disguise.
Such were my thoughts yesterday about the potential double top and selling nerby:
(…) the pressure to go higher is building under the surface in my opinion. I says so because should the bears be willing to sell heavily in the 3220-3230 zone (potential double top area), they would have done so – the fact they haven't been willing to push prices materially lower, is telling by itself.
Yes, the volume behind the upswing off the late June lows hasn't been outstanding, but only prices falling sharply and preferably also on rising volume, would make it a double top. Prices merely approaching previous local top don't make it so, and could trick the bulls into taking profits off the table prematurely. The battle to overcome them might not turn out to be all that fierce in the end.
Have the scales tipped into the bulls' favor some more with yesterday's action in the creadit markets arena?
The Credit Markets’ Point of View
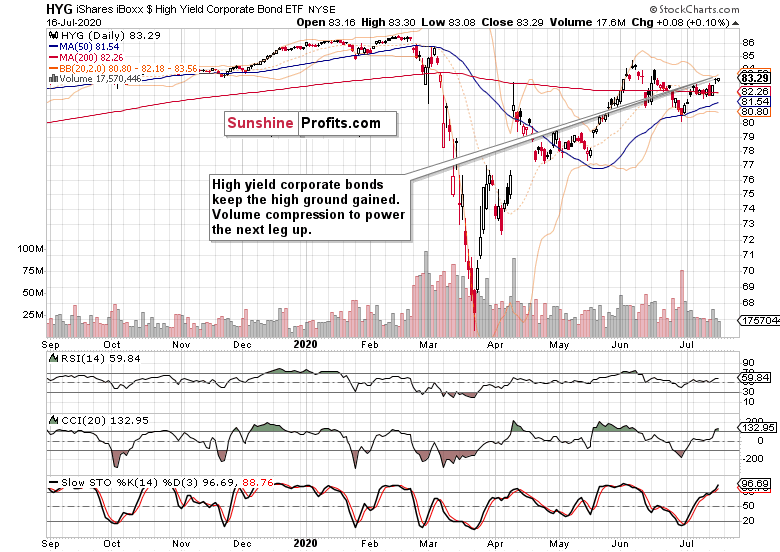
The action in high yield corporate bonds (HYG ETF) is positive. They're keeping above the trading range of recent sessions, and the decreasing volume isn't an issue – quite to the contrary, as its drying up on a slight move lower hints that the market really wants to go in the opposite direction, and not down.
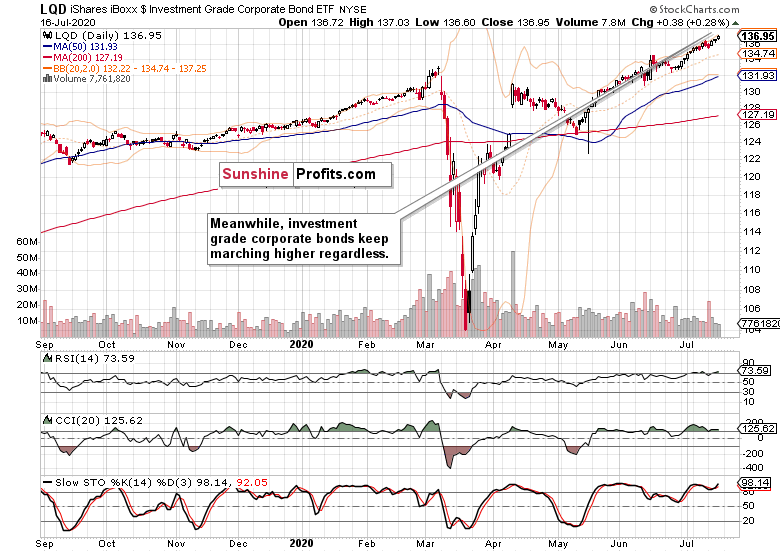
Investment grade corporate bonds (LQD ETF) confirm the bullish HYG takeaway, and are making new highs. Their path of least resistance is undeniably higher.
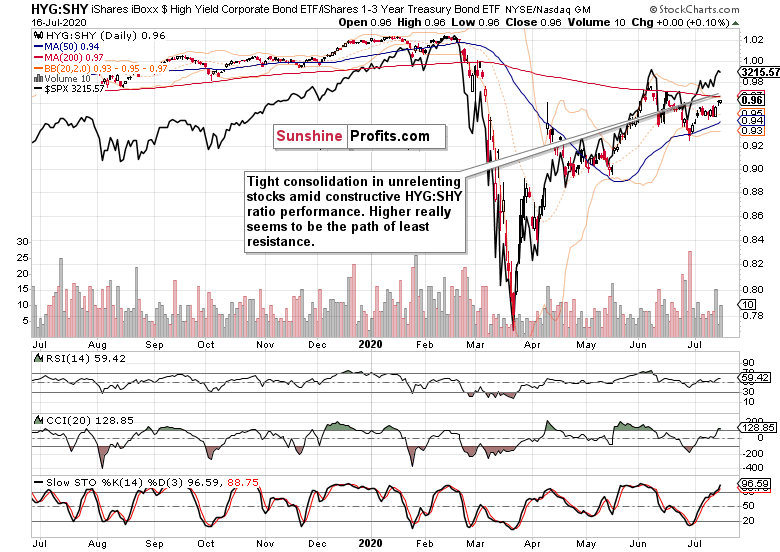
Both the high yield corporate bonds to short-term Treasuries (HYG:SHY) ratio and the overlaid S&P 500 closing prices show no new sudden dislocation striking the eye. Both are moving higher, just taking their time.
As I wrote about the stock upswing yesterday:
(…) Looking under the hood of the S&P 500 thus reveals that stocks aren't getting vulnerable and extended in any dramatic way. Their upswing continuation is amply supported by the credit markets.
Smallcaps and Technology Speak
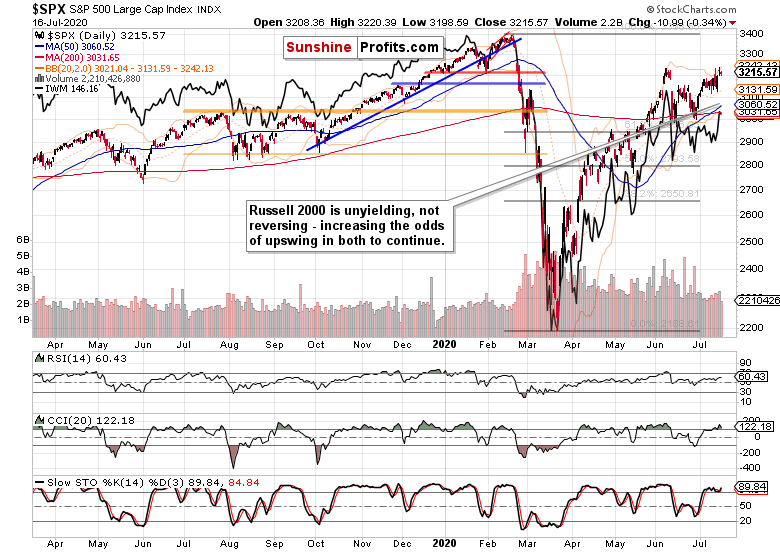
While Wednesday's sprint higher in the Russell 2000 (IWM ETF) hasn't been extended yesterday, the high ground gained has been maintained. And that bodes well for the upswing in both indices to continue.
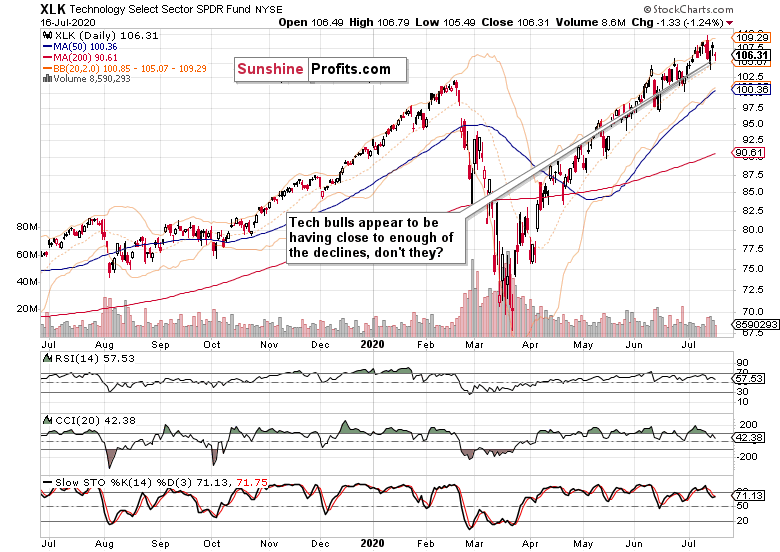
Meanwhile in tech (XLK ETF), the waves of selling appear to be running into brick walls. It doesn't matter that yesterday's upswing got rejected – what counts to me more, are the noticeable lower knots of the two recent sessions that point to buying power emerging to buy the dip.
From the Readers' Mailbag
Q: Well I see TLH at record levels, only a notch smaller than its peak at march. This was not the case in June, and it is steady rising since then. I'd be very cautuous with Monica call to disregard everything and stare at these 3 points ahead. What about the 17 points downside risk to DMA? It was crossed many times now, will it hold every time?
A: It's true that both TLH and TLT (ETFs for longer-dated Treasuries) are trading at high levels. The tape though supports the stock bulls. While it's no ploughing in on the long side at any price, the buyers are the ones favored by the market action.
Next, some thoughts about the stock and bond bull runs.
In a bull market, bonds top first, and are followed by stocks then. The bond guys get it right most of the time – just as they did earlier in 2020. As for commodities, they top the last as e.g. the memorable oil run in 2008 shows.
On one hand, rising bond yields lend credibility to the recovery story. On the other hand, decreasing real interest rates (the reward for holding bonds once the rate of inflation is reflected) drive the TINA trade (the there-is-no-alternative trade is supported also by the dividends' side of the story – who would have thought that selected blue chip bonds would carry a higher coupon many years or better decades ago?).
That's an argument for why I am not concerned by the Treasuries' bull run – it adds more fuel to the stock's one.
Summary
Summing up, the waiting in tech appears close to being over, cyclicals aren't throwing in the towel in any way, and the S&P 500 appears ready to take on the early June highs once more, regardless of emerging markets suffering a setback yesterday. The dollar is playing games of deceptively strong appearance only to roll over next, meaning that the credit-market supported high odds of the S&P 500 invalidating the double top theory are gaining a new lease of life.
Yes, I think the 3230ish area will be overcome – and I say forget the barrage of negative news and look instead how the markets are just shaking them off. That's a strong bull run to me, higher in the face of negative news or the Fed on pause. Read the charts, follow the money – the signs of something fishy will manifest themselves well ahead. For now, the overall path of least resistance in the S&P 500 remains higher.
Thank you for reading today’s free analysis. I encourage you to sign up for our daily newsletter - it's absolutely free and if you don't like it, you can unsubscribe with just 2 clicks. If you sign up today, you'll also get 7 days of free access to the premium daily Stock Trading Alerts as well as our other Alerts. Sign up for the free newsletter today!
Monica Kingsley
Stock Trading Strategist
Sunshine Profits: Analysis. Care. Profits.
* * * * *
All essays, research and information found above represent analyses and opinions of Monica Kingsley and Sunshine Profits' associates only. As such, it may prove wrong and be subject to change without notice. Opinions and analyses were based on data available to authors of respective essays at the time of writing. Although the information provided above is based on careful research and sources that are believed to be accurate, Monica Kingsley and her associates do not guarantee the accuracy or thoroughness of the data or information reported. The opinions published above are neither an offer nor a recommendation to purchase or sell any securities. Ms. Kingsley is not a Registered Securities Advisor. By reading Monica Kingsley’s reports you fully agree that she will not be held responsible or liable for any decisions you make regarding any information provided in these reports. Investing, trading and speculation in any financial markets may involve high risk of loss. Monica Kingsley, Sunshine Profits' employees and affiliates as well as members of their families may have a short or long position in any securities, including those mentioned in any of the reports or essays, and may make additional purchases and/or sales of those securities without notice.
*********

Monica Kingsley is a trader and financial markets analyst. Checking dozens of charts daily, she integrates their messages with economics and in-depth experience. Trade calls and writing are her cup of tea as much as studies in market histories. Having been at the financial markets when the Great Recession arrived, she experienced many bull and bear markets - be it in stocks, bonds, gold and silver. https://www.monicakingsley.co
More from Silver Phoenix 500


