A Hard Look At Silver And The Markets


I was going to take this week off, but there are so many interesting things to cover in the gold and silver markets I decided not to. Let’s start with a Bear’s Eye View (BEV) of the silver market going back to 1969. A BEV chart displays a market as Mr Bear sees it; each new all-time high (BEV Zero) is equal to a Big-Fat Zero on the Red 0.00% Line, all data points not a new all-time high are represented as a percentage decline; the claw back by Mr Bear from an all-time high.
The 1969-1980 bull market in silver (2532%) saw two corrections (3.0 & 4.5 years in duration) neither were deeper than 40%. The 1969-1980 bull market’s last all-time high (or Terminal Zero {TZ} in BEV jargon) occurred on 17 January 1980 with silver closing at $48.70. Incredibly this TZ from thirty-six years ago still stands as silver’s last all-time high. Silver then endured a twenty-two year, 90% bear market, from which our current bull market began. Our bull has taken silver from $4.03 in November 2001 to $48.58 (1103%) in April 2011, just twelve cents short of becoming a new all-time high. Currently silver is in a 4.5 year, 70% purgatory of a bull market correction. There is good reason to believe we are at, or very near the bottom of this correction.
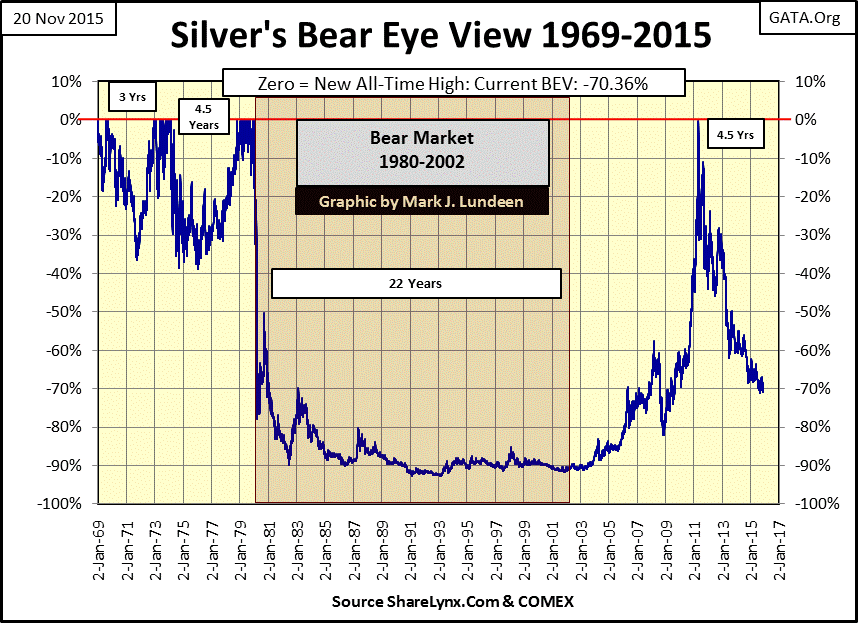
An interesting point to make above is how silver in November 2009 went from below its BEV -80% line to just pennies from making a new all-time high in little more than two years. The Dow Jones made a similar recovery from its Great Depression’s low, but took twenty-two years to do it (1932-1954). When silver wants to move, it moves with great power. But at the bottom of a 4.5 year 70% correction, few market watchers believe silver could do an encore performance in the years to come. But I do, and then some when corporate earnings begin to crumble and defaults erode confidence in the bond market.
Most “market experts” claim gold and silver do well only in an inflationary environment, pointing to the government’s bogus CPI data to justify their poor expectations for gold and silver. Apparently they are totally unware the financial markets have been subjected to unrelenting inflation since Congress created its Federal Reserve in 1913. For most of that time it has been the stock market benefitting from the monetary inflation flowing from the Federal Reserve, not gold and silver. The following chart plotting the indexed value of:
-
CinC (Currency in Circulation: paper money in circulation)
-
The Dow Jones
-
Gold & Silver
makes the point.
In the chart’s insert covering the fifty years from January 1920-70 we see how CinC increased by a factor of 12.05, the Dow Jones increasing by a factor of 7.44. But the price of gold and silver barely moved during this inflationary fifty year period. However, in the next ten years that was to change as we see in the text box documenting the factors for January 1980.
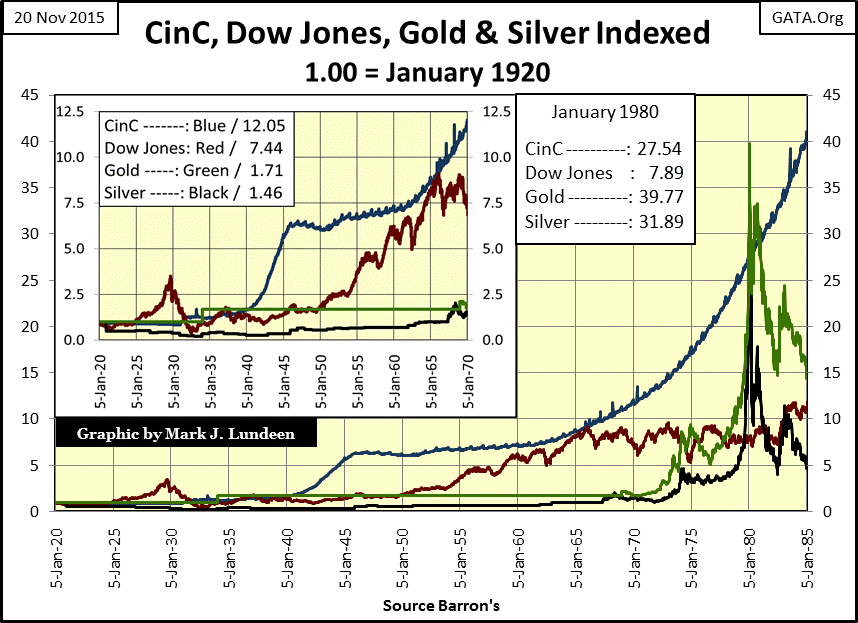
What catalyst made the decade of 1970-1980 so beneficial to the old monetary metals? Monetary inflation from the 1940s began flowing into consumer prices.
“November 15, 1951 reached a new low of 53 cents in terms of 1935-1939 dollar value. In extended comment on the shrinkage of the dollar, the National City Bank’s December Letter says: “From the standpoint of the creditor—the buyer of Savings bonds, the pensioner, the insurance beneficiary, the school teacher with lagging pay—the experience during and since World War II has been disheartening. Inflation is a concealed type of tax and these are the people who took the brunt of it.” In line with the repeated views of Professor Sumner H. Slichter, the City Bank adds: “People reconciled to a dollar of wasting value look around for real estate or other equity investments as a hedge against price inflation and dollar shrinkage.”
- Barron’s Editorial, 31 Dec 1951
The bond market in the 1950s began demanding an inflation premium to compensate bond buyers for rising consumer prices. By the 1970s rising interest rates and consumer prices ignited a bull market in gold and silver as confidence in the US dollar finally came into question.
Note below how the gold bull market of the 1970s occurred in a rising interest rate environment. The 1980-2001 bear market in gold and silver coincided with declining interest rates. The current bull market in stocks and bonds began in 1981 with the collapse in bond yields. Interest rates have been manipulated since Alan Greenspan became Fed Chairman in August 1987, so it’s not surprising interest rates have continued to decline since gold and silver began their bull market in 2001.
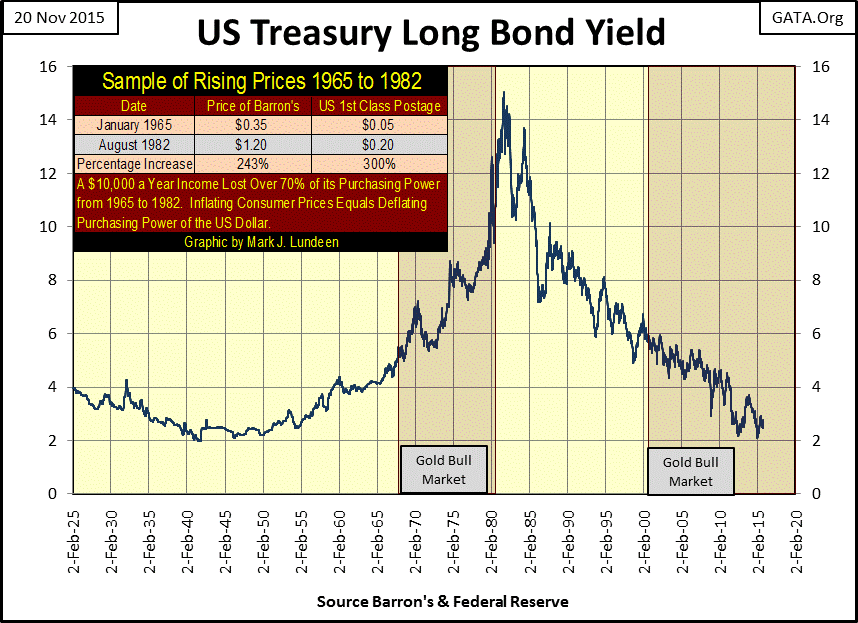
Currently governments at all levels, as well as consumers and corporations are burdened with debt that ultimately will be defaulted on. As the first wave of counterparty failure arrives in the financial markets, we’ll see bond yields once again rise toward double digit levels, and the people selling their deflating bonds won’t ask Janet Yellen for permission.
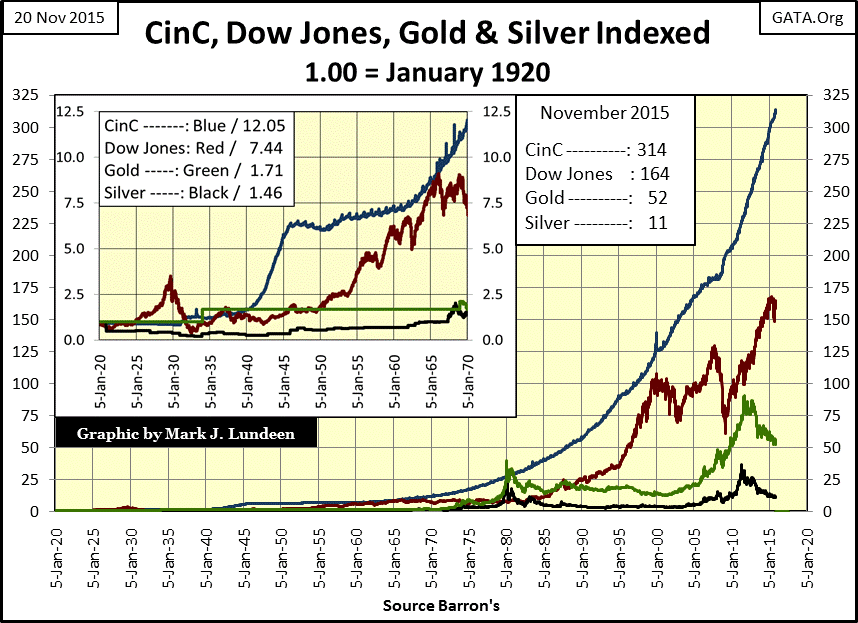
Here’s the updated continuation chart of the indexed data from above. Since the Dow Jones market top of 2000, it’s become obvious the “policy makers” have had less success “injecting” their monetary inflation (Blue Plot) into the stock market (Red Plot). The day is coming when the stock market will completely decouple from the rising money supply, and Janet Yellen and her minions at the FOMC will standby helpless as the Dow Jones sees another historic market crash. As since 1913, where CinC has only gone up and never comes down, when bond yields once again rise up and stocks crash, the dollar price of gold and silver by necessity will rise up as they did during the 1970s as wealth flees dollar-dominated financial assets, and the “global reserve currency” itself: the US Dollar.
Now let’s go on to my second BEV chart of silver spanning the current bull market. This BEV series originates on 02 November 2001 to better see the ups and down of silver’s current bull market. Silver has seen five corrections since November 2001, each correction saw a deeper percentage decline than the previous one. However note only correction D (the sub-prime mortgage crisis) actually took the price of silver below its previous correction price. Even at the bottom of today’s 70% decline in the price of silver, it still $5.32 above its bottom price of November 2008. What’s to make of that? Since November 2001 silver has been in a crazy bull market, but a bull market nonetheless.
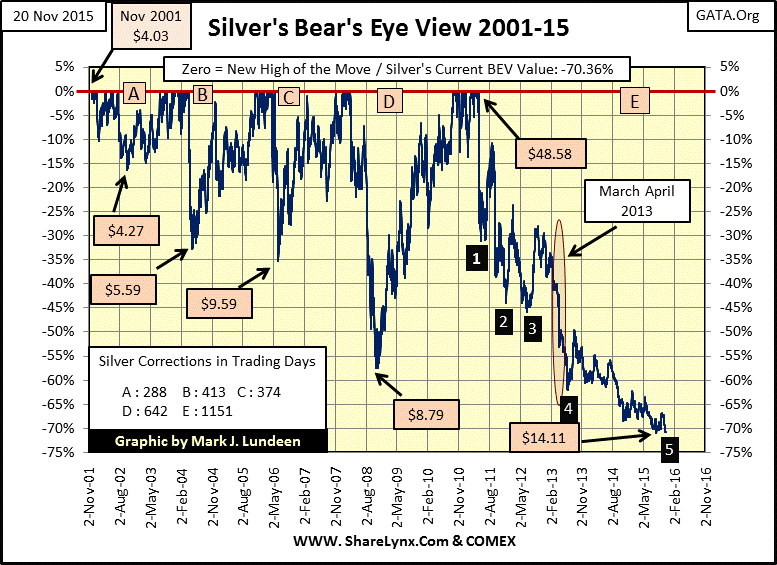
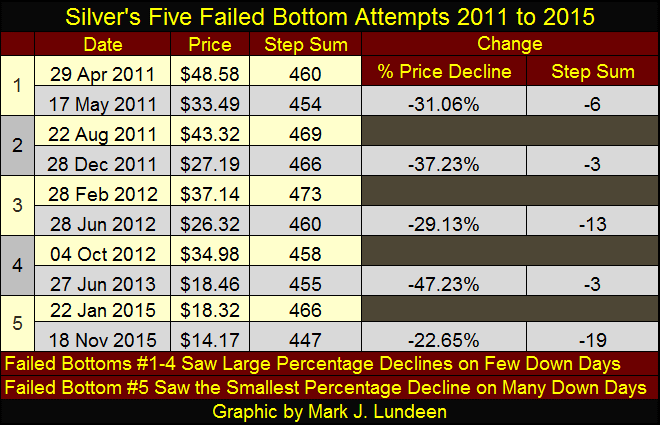
Take a moment and study silver’s BEV chart above. Its current correction (E) is very odd when compared to the previous four. Corrections A-D all saw silver quickly collapse to their lows, from which silver then recovered to new BEV Zeros (new highs of the move) forming nice V-shape bottoms in the plot. The table located at the chart’s lower left list the length in trading days for these corrections. Our current correction (E) is unique as in the past 4.5 years this has yet to happen, though silver has attempted to do just this four times, five if we include silver’s current down leg spanning from August 2013 to present.
I placed four numbered Black Boxes in the (E) correction at points where silver could have bottomed, but failed to reverse upward to new BEV Zeros as it did four times since 2001. Seeing silver given these four opportunities to bottom in the past 4.5 years, only to refuse to go on to new BEV Zeros is very strange. I placed a black box (#5) at the bottom of our current down leg in correction (E); August 2013 to November 2015, though in the table below I used data only from the highs of last January. The chart action since August 2013 is unique. Nothing like it can be seen with the other four failed bottom attempts of correction (E), or at any other time since November 2001. The chart action of the past two years gives the impression of silver being dragged down against its will as it struggles against its assailants.
In the table below we see silver’s percentage declines prior to their failed bottoms seen above with their step sums. With failed bottoms 1-4 we see significant percentage declines occurring with hardly a change in silver’s step sum. Historically this has almost always been true with declines in the price of silver. So, what’s with #5? Silver has seen the smallest percentage decline on the largest number of net down days in the step sum. And we need to note that most of the net down days seen in #5 below (15 net down days) have taken place only within the past month; since October 28th. This is very strange too.
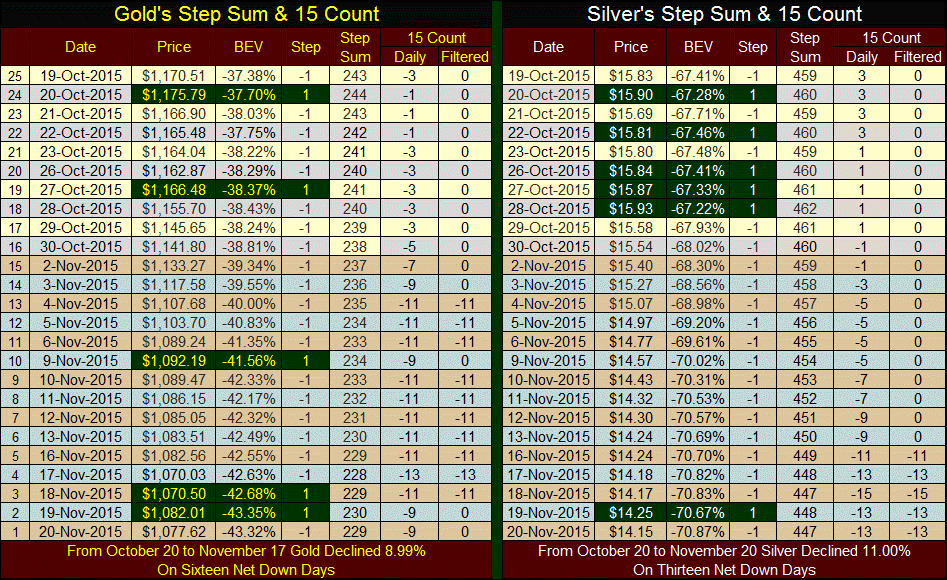
Below are tables showing gold and silver’s price, step sum and 15-count from mid-October to the Friday’s close. Advancing days are highlighted in Green. Since October 19th both gold and silver has seen advancing days overwhelmed by declining days. From October 20th to November 17th, gold has declined 8.99% on a net sixteen down days, with silver declining 10.81% on a net of twelve down days. Note since October 29th silver has seen fifteen consecutive down days (15-count). Since January 1969 this is a first, yet silver is down only 10.81%? Gold’s 15-count also saw a historic low of -13 on November 17th as its price declined only 8.99% from October 20th.
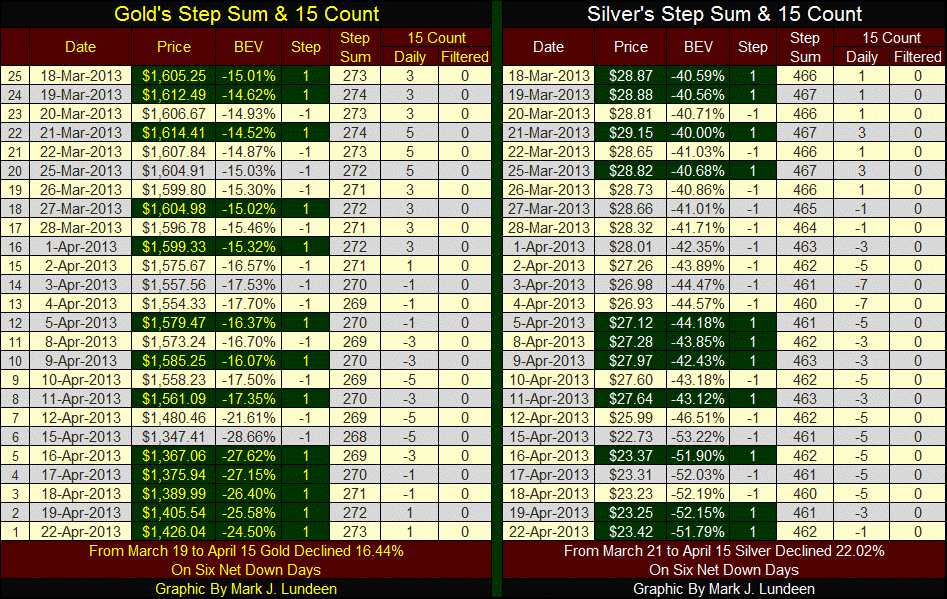
In silver’s BEV chart spanning 2001 to present (above), I placed a Red Oval over the market decline of March - April 2013 (failed bottom #4). Below is gold and silver’s price and step sum table for this 2013 decline. This was a devastating market decline for gold and silver. Yet look at all the advancing days highlighted in green during these five weeks. The price of gold dropped 16.44% from March 19th to April 15th on a net of only six declining days. Silver dropped 22.02% from March 21st to April 15th on a net of only six declining days. During the twenty five trading days the table below covers, gold’s step sum ended where it began (273) while silver’s was down by only four days. This is a huge difference from what we see above, and indicates we are very close to the bottom in the current correction for gold and silver.
The point to come away with all this isn’t that the price of silver and gold today is more manipulated than it was in the spring of 2013. As silver’s last all-time high is still from January 1980, it’s fair assuming the price of silver has been controlled by Wall Street since they took out the Hunt Brothers thirty-six years ago. What else besides silver is currently 70% below its price of January 1980? In November 2015, absolutely nothing else found at supermarkets or shopping malls that I’m aware of is cheaper than it was in 1980, yet silver is down 70% from its price of January 1980!
The point I make from looking at this data is that for the Federal Reserve and the big NY banks who have manipulated the price of the old monetary metals for decades, is that the selling of fictional gold and silver by the thousands of tons in London and New York has become a game of greatly diminishing returns. I can’t say when, but the bull market in gold and silver are far from over.
More from Silver Phoenix 500


