Inflation (Lack Of) Expectations


I neglected to include an important one from a different vantage point, the Silver/Gold ratio. So let’s tuck it in right here at the top of the post. While there are other utilities for this indicator, a decline is surely in keeping with the deflationary hints of the charts that follow and if silver gets out of hand vs. gold to the upside one day it would be an inflationary signal, among other things.
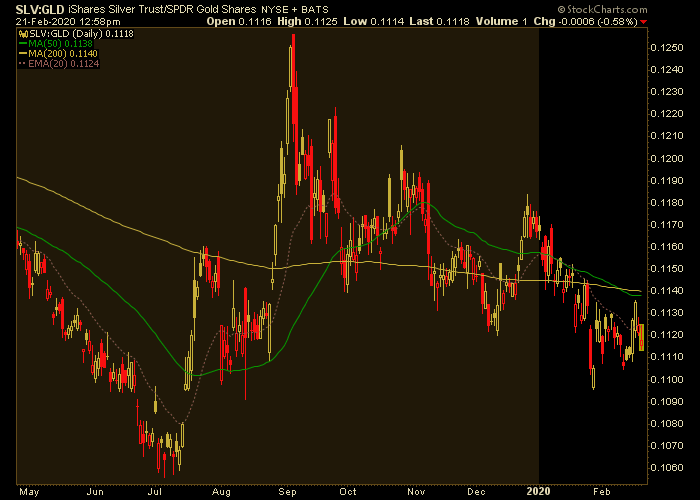
We know that they are conspiring to do whatever it takes to get inflation up, because without inflation its evil (to Keynesian economists and Federal Reserve officials, anyway) opposite, deflation would take hold and take things too far. The little whirlpool is circling the drain but there is still water * in the pool.
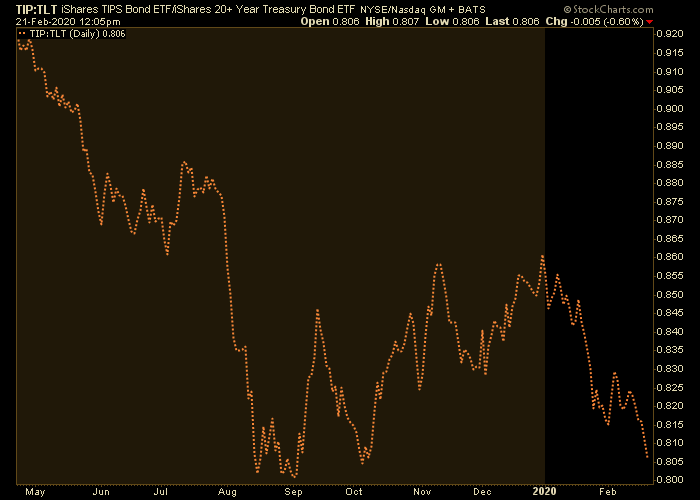
Here are some pictures of failing inflation, despite a still brisk economy and economic data like the big bounce in the Philly Fed and it’s respondents’ expectations of higher prices to be charged going forward.
TIP/TLT ratio
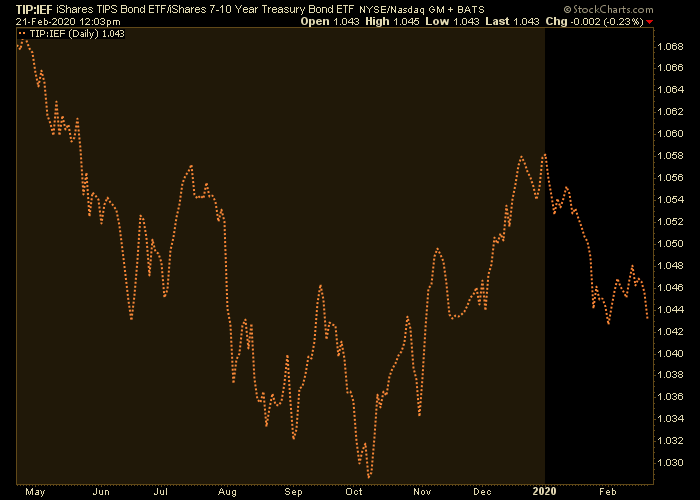
TIP/IEF ratio
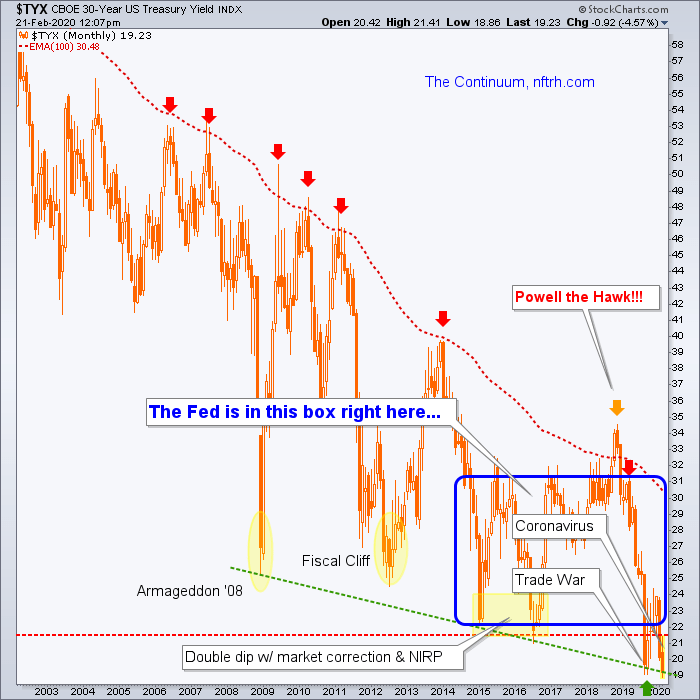
30-year yield burrowing to a new low.
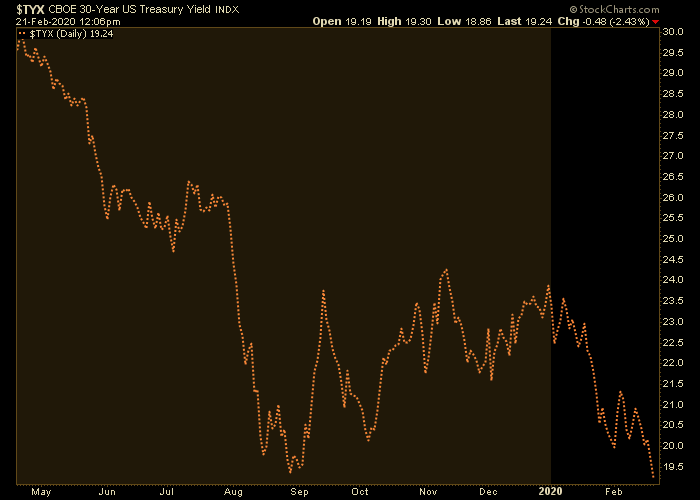
Which of course informs its precarious big picture, showing the Fed is out of its comfort box in the opposite direction as it was in late 2018 when it was inexplicably (to most onlookers, but not we Continuum watchers) hawkish. Now? They may jawbone about the good economy and no need for rate cuts or the use of exotic tools, but the Continuum (a key macro indicator tracked in NFTRH since its inception over 11 years ago) will decide those things. It’s back in the deflationary danger zone.
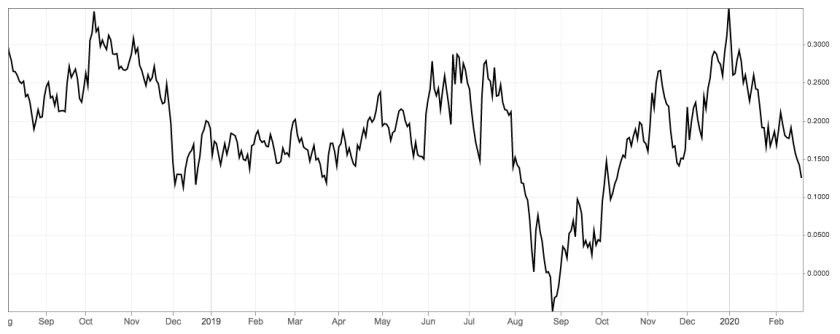
The yield curve (source: CNBC) is once again flattening. My suspicion (being a lowly casino patron trying to make sense of this mess, as are you) is that the stock market is not necessarily in trouble during this re-flattening, but when the next real steepener comes it is going to either suck the whole pool of sludge down the drain (deflationary) or radically change the dynamics of the cyclical macro to inflationary, giving the Central Banks what they have been trying to conjure… and then some (think of equal and opposite reactions, as this current slide in the Continuum above is to 2018’s aborted upside yield breakout).
* Polluted as it is by the toxic turds dumped by policy makers since Q4 2008.
Subscribe to NFTRH Premium (monthly at USD $35.00 or a discounted yearly at USD $365.00) for an in-depth weekly market report, interim market updates and NFTRH+ chart and trade setup ideas. You can also keep up to date with actionable public content at NFTRH.com by using the email form on the right sidebar and get even more by joining our free eLetter. Follow via Twitter @NFTRHgt or StockTwits.
********
More from Silver Phoenix 500


