Silver Market Update


Although at first glance a tricky call, because superficially a Bear Flag appears to be completing in silver. However, on closer inspection it now looks like silver’s correction is done and an intermediate base pattern is completing. In this event we are at an excellent entry point for many silver stocks, which have been savagely beaten down over the past several months - a necessary correction following their outsized run-up earlier in the year.
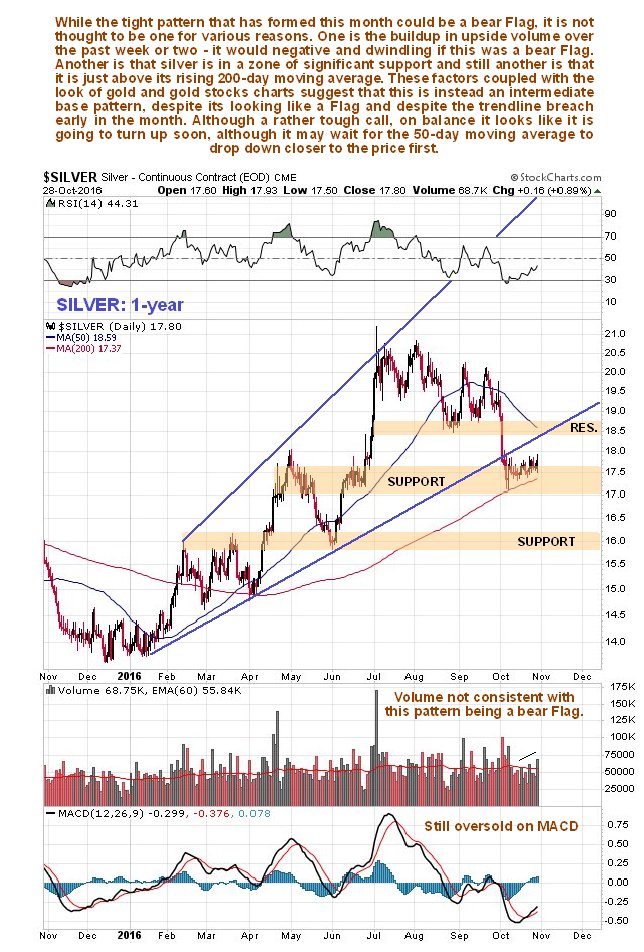
On its 1-year chart we can see that silver’s corrective action from early July has brought it all the way back to its steadily rising 200-day moving average, a classic buy spot, where a potential intermediate base has formed. This corrective action has more than completely unwound the earlier overbought condition. However, there are grounds for concern on two counts – one is that the steep drop early in October broke the price below the uptrend line shown and the other is that the pattern that has since formed looks very much like a Bear Flag at first glance. Moreover, if it is so another sharp drop will follow soon. Thus it is interesting to observe that the volume pattern is not consistent with this being a Bear Flag, instead it is consistent with this being an intermediate base pattern. To properly examine the volume pattern in this sideways formation, we need to refer to a 3-month chart, which opens it out sufficiently to see what is going on in detail.
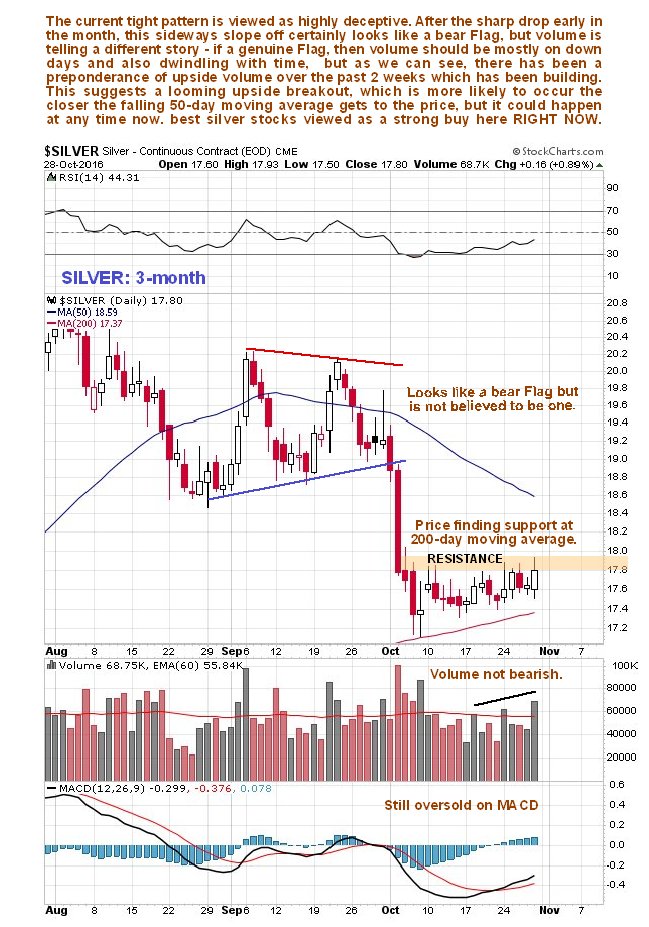
On the 3-month chart we can see in detail the tight pattern that has developed following the sharp drop early in October. It looks like a bear Flag until you look at the volume. Instead of a volume pattern consistent with a bear Flag, which would feature greater downside volume days than upside volume, and a steady trend to lighter volume, we have the exact opposite over the past couple of weeks – greater upside volume days and a trend of increasing volume. This suggests that, to steal a term from infowars or zerohedge, that this is a “False Flag” that will lead to an upside breakout.
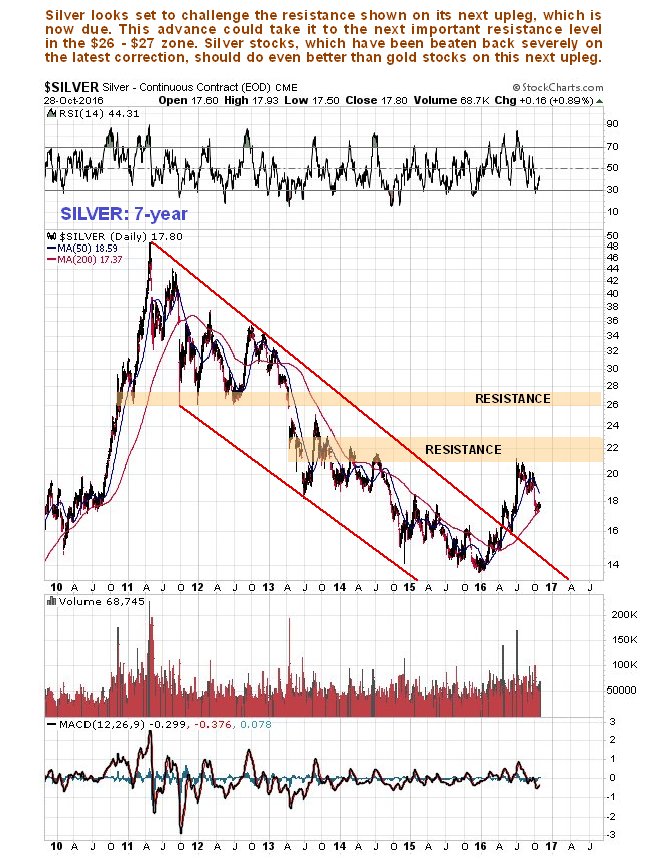
On silver’s 7-year chart we can see the 2011 – 2015 bear market in its entirety, and how breakout from the major downtrend channel led to a not particularly impressive rally up to important resistance, where the advance stalled out and reaction set in. The relative feebleness of the rally following the breakout from the downtrend is not a cause for concern, as in the early stages of a bull market gold tends to outperform silver, and it certainly didn’t bother silver stocks any. Silver’s next major upleg should take it above this resistance, albeit perhaps after something of a battle, and then on towards the next important resistance level in the $26 - $27 zone.
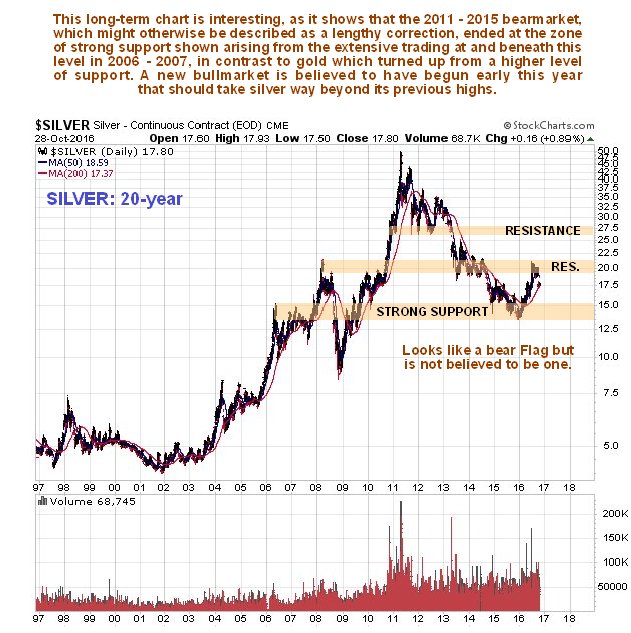
Although silver’s long-term 20-year chart presents a messier picture than gold’s 20-year chart, it does also show that the 2011 bear market may be viewed as a big correction to the major bull market advance from late 2001, as is the case with gold. Unlike gold’s corrective bear market which stopped at a major support level related to an extensive period of trading in 2008 – 2009, silver dropped down through its corresponding support level on its corrective bear market, and found support at a lower level related to an extensive period of trading in 2006 – 2007. All of this does mean that, so far, silver has been underperforming gold.
********
Courtesy of Courtesy of http://www.clivemaund.com
More from Silver Phoenix 500


