S&P500 To 3000 First…and Then…?


When I last wrote on April 26th, I was looking for a move above 2960. We tagged 2954 on May 1 and then pulled back to 2862 on May 7th. The SPX fell into a rising channel formation and decline to go below 2860, which means to me we have one more rally left before we see a more significant decline later in May and early June.
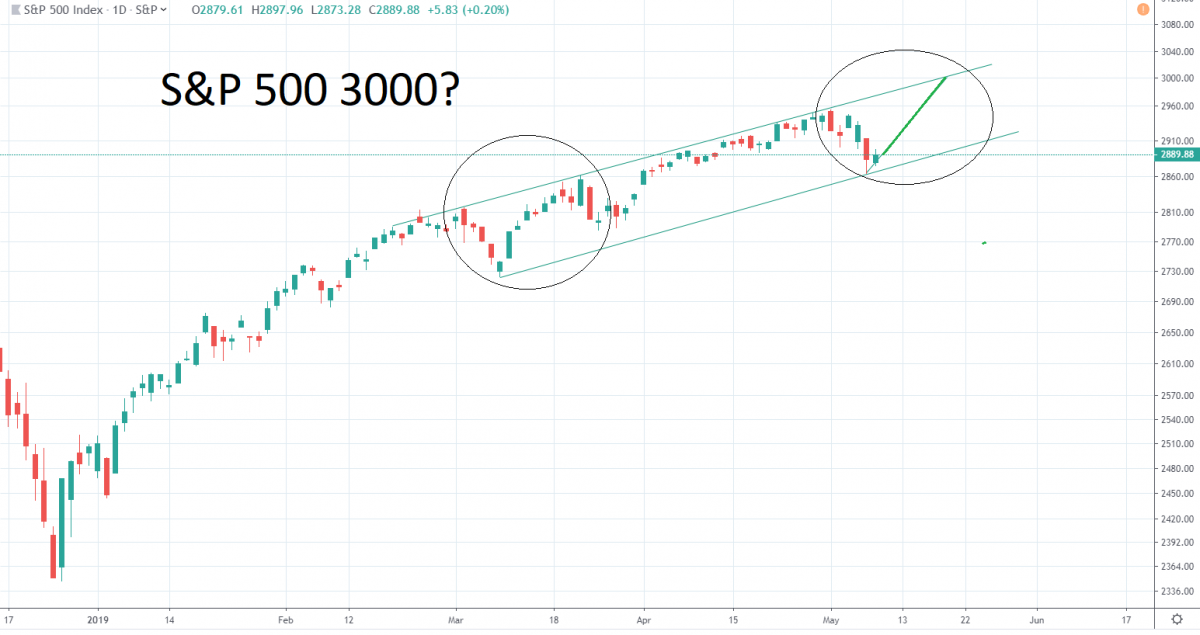
The 20-week low runs 100 trading days +/- 15 TD’s. While May 7th was 90 trading days out from the end of December low, it doesn’t fit the expectation time or price wise of a B wave pull back in an A-B-C type rally.
May 7th had Venus square Saturn after Mars squared Jupiter on Sunday. The main part of this pull back was squeezed in between these two aspects: one, a sell-off caused by Trump, and two, a washout with the Chinese capitulating. Also, we have a Bradley turn due May 17 with the full moon on monthly expiration and the above pattern, which is bullish.
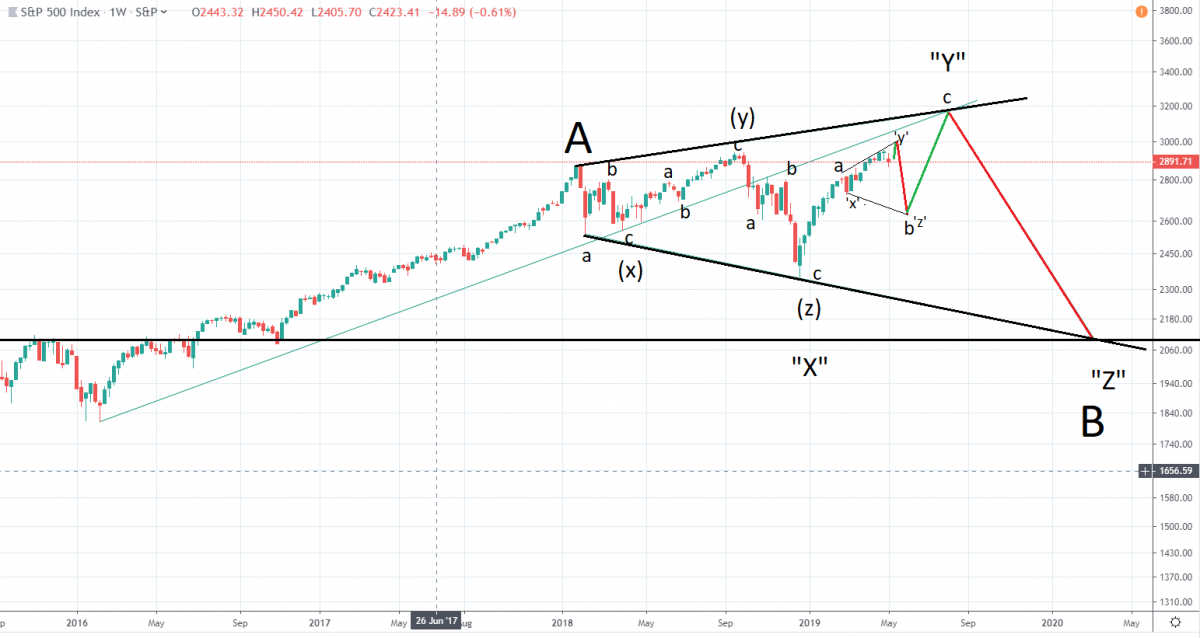
The 5 quarterly cycle top week cycle is due in this general time frame and so is the 8 month cycle top. A move like Jan 26-Feb 9 is due soon, in my opinion, and that finishes Wave B (watch out all those short VIX players!) and C comes next, which I forecast as coming in late July (could be early August) according to the Rising Wedge and the next chart shows an Equality of Waves (C = A in time and price) move and snap back to the uptrend line lining up in early August right at or near 3170.
I have Wave A terminating on February 24 at 2810 and (x) in early March. The current rally (Wave [y]) is irregular (highly so) and counts a-b-c with “b” being a Running Correction ending on May 7th. “c’ should terminate on May 20th and the [z] wave drop should occur May 20-June 4, where there is another Bradley turn. June 4th would be 109 trading days, which fits the cycle variance.
There are a lot of trines into the 18th and trines are generally bullish astro aspects. We have two Thur-Sat this week, so it wouldn’t surprise me that we have a melt-up into Friday and the Donald gets the deal done, (or so we thing). The 4/8 TD pattern has lows on May 13th and 17th. May 20th should be the top and the next low should occur on May 22 with a 4 TD top on the 24th. The expected sell-off should start in earnest after the Memorial Holiday.
Below is a weekly chart of the SPX showing the summer top “Y” and “Z due early next year near 2100 (the 4 year cycle). I’m looking for a 33-34% drop!!
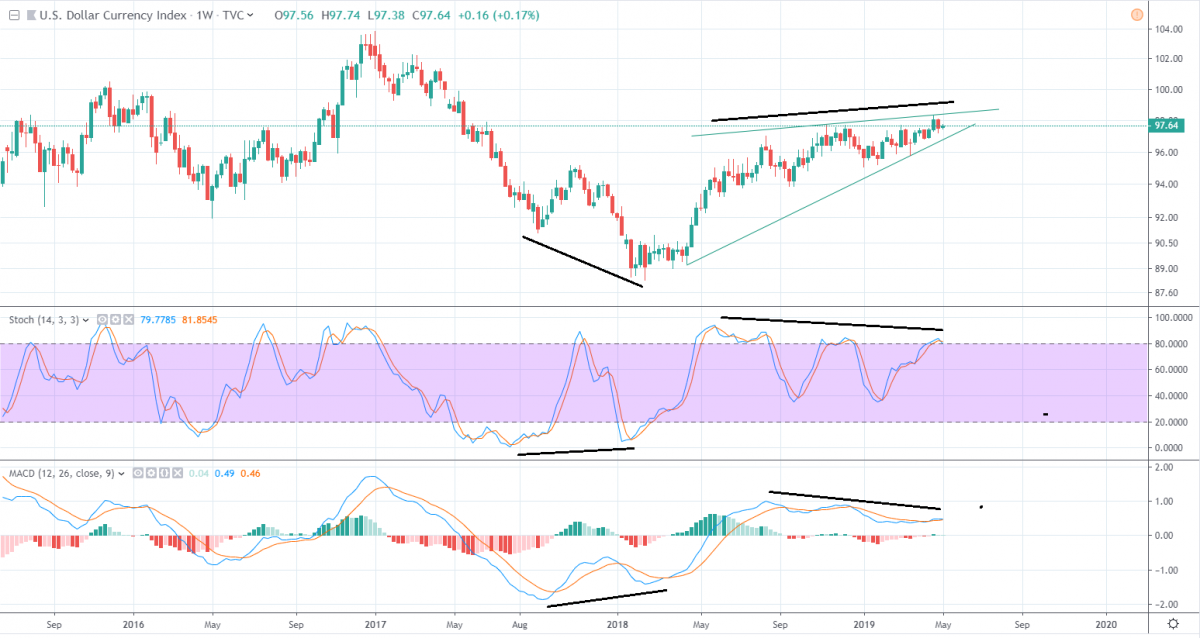
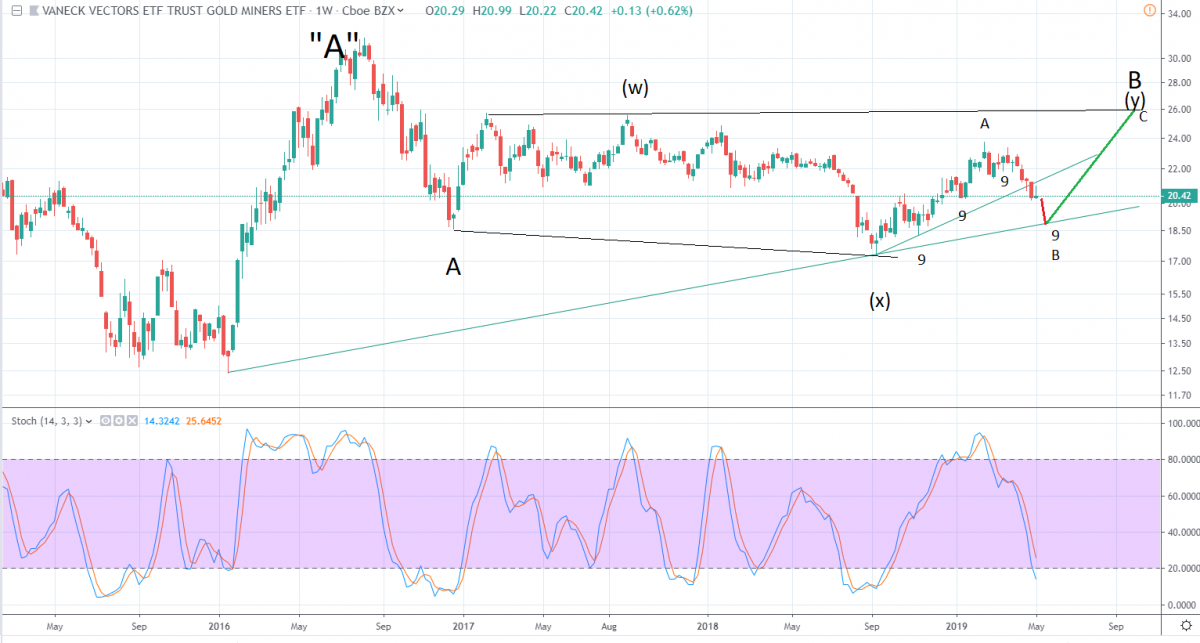
Below are charts of the dollar and the mining chare index GDX. The dollar looks toppy into late May and early June. The mining shares still look weak to me and are likely to fall as the stock market rallies into May 20. After May 20th, I believe we begin the “c” wave of an a-b-c type rally off last summer’s low. I believe a 36-37% rally is due in this sector once we bottom. NUGT should do very well, IMO.
Brad Gudgeon, Editor
BluStar Market Timer
http://blustarmarkettimer.info
********
More from Silver Phoenix 500


